Immigrants from Taiwan vs Nepalese Poverty
COMPARE
Immigrants from Taiwan
Nepalese
Poverty
Poverty Comparison
Immigrants from Taiwan
Nepalese
9.7%
POVERTY
100.0/ 100
METRIC RATING
4th/ 347
METRIC RANK
14.0%
POVERTY
0.3/ 100
METRIC RATING
244th/ 347
METRIC RANK
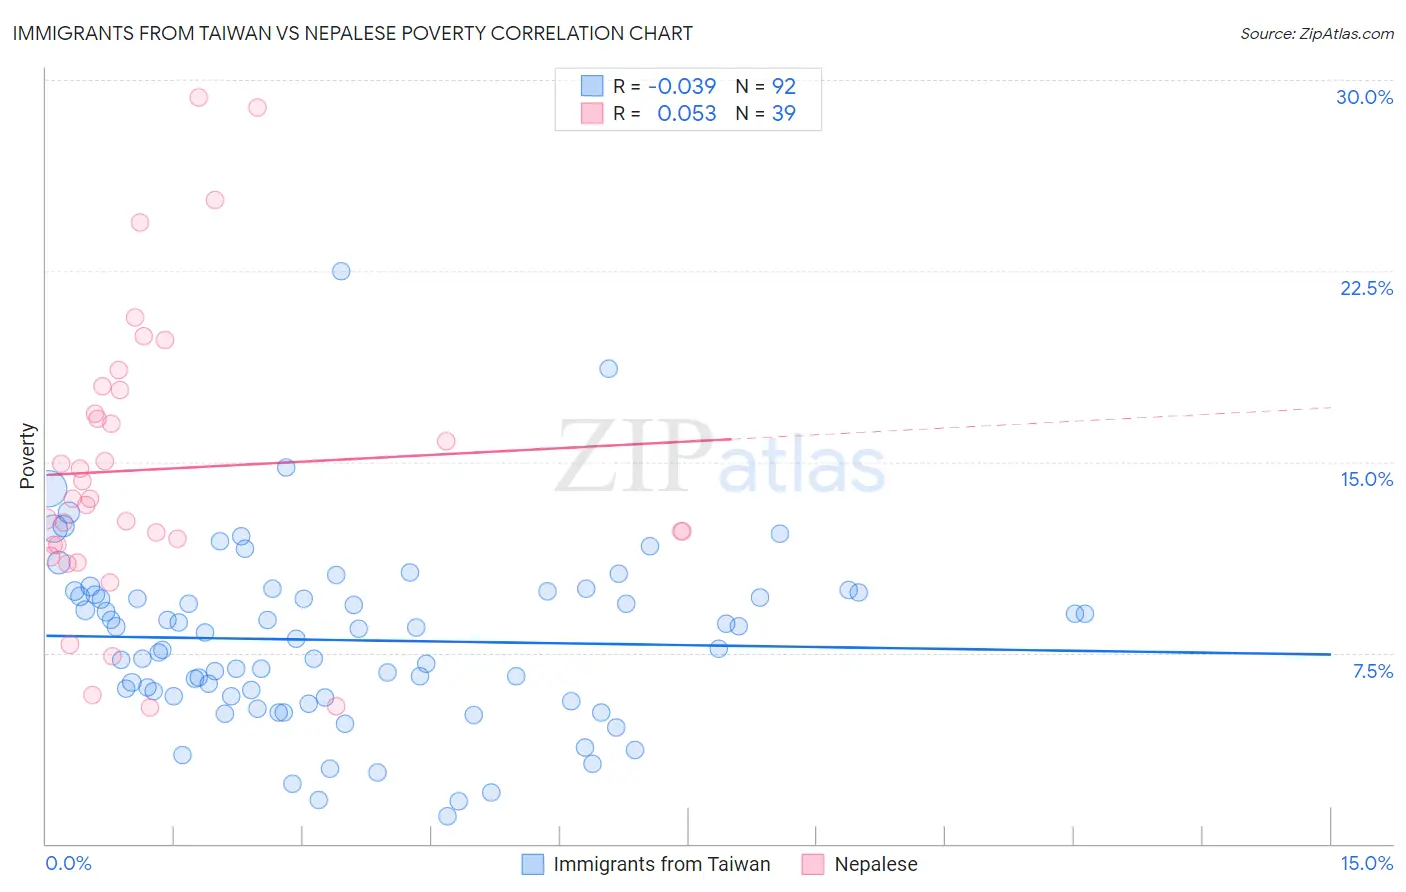
Immigrants from Taiwan vs Nepalese Poverty Correlation Chart
The statistical analysis conducted on geographies consisting of 298,124,801 people shows no correlation between the proportion of Immigrants from Taiwan and poverty level in the United States with a correlation coefficient (R) of -0.039 and weighted average of 9.7%. Similarly, the statistical analysis conducted on geographies consisting of 24,519,269 people shows a slight positive correlation between the proportion of Nepalese and poverty level in the United States with a correlation coefficient (R) of 0.053 and weighted average of 14.0%, a difference of 44.1%.
Poverty Correlation Summary
| Measurement | Immigrants from Taiwan | Nepalese |
| Minimum | 1.1% | 5.4% |
| Maximum | 22.5% | 29.3% |
| Range | 21.4% | 23.9% |
| Mean | 8.0% | 14.7% |
| Median | 8.2% | 13.6% |
| Interquartile 25% (IQ1) | 5.8% | 11.7% |
| Interquartile 75% (IQ3) | 9.8% | 17.8% |
| Interquartile Range (IQR) | 4.0% | 6.1% |
| Standard Deviation (Sample) | 3.5% | 5.7% |
| Standard Deviation (Population) | 3.5% | 5.6% |
Similar Demographics by Poverty
Demographics Similar to Immigrants from Taiwan by Poverty
In terms of poverty, the demographic groups most similar to Immigrants from Taiwan are Thai (9.6%, a difference of 1.5%), Chinese (9.5%, a difference of 1.9%), Immigrants from Ireland (10.1%, a difference of 3.7%), Assyrian/Chaldean/Syriac (10.1%, a difference of 3.8%), and Filipino (10.1%, a difference of 4.0%).
| Demographics | Rating | Rank | Poverty |
| Immigrants | India | 100.0 /100 | #1 | Exceptional 9.0% |
| Chinese | 100.0 /100 | #2 | Exceptional 9.5% |
| Thais | 100.0 /100 | #3 | Exceptional 9.6% |
| Immigrants | Taiwan | 100.0 /100 | #4 | Exceptional 9.7% |
| Immigrants | Ireland | 99.9 /100 | #5 | Exceptional 10.1% |
| Assyrians/Chaldeans/Syriacs | 99.9 /100 | #6 | Exceptional 10.1% |
| Filipinos | 99.9 /100 | #7 | Exceptional 10.1% |
| Maltese | 99.9 /100 | #8 | Exceptional 10.2% |
| Immigrants | South Central Asia | 99.9 /100 | #9 | Exceptional 10.2% |
| Bulgarians | 99.9 /100 | #10 | Exceptional 10.2% |
| Immigrants | Lithuania | 99.9 /100 | #11 | Exceptional 10.3% |
| Bhutanese | 99.8 /100 | #12 | Exceptional 10.4% |
| Immigrants | Hong Kong | 99.8 /100 | #13 | Exceptional 10.4% |
| Immigrants | Bolivia | 99.8 /100 | #14 | Exceptional 10.4% |
| Bolivians | 99.8 /100 | #15 | Exceptional 10.4% |
Demographics Similar to Nepalese by Poverty
In terms of poverty, the demographic groups most similar to Nepalese are Sudanese (14.0%, a difference of 0.030%), Ecuadorian (14.0%, a difference of 0.10%), Immigrants from Sudan (14.1%, a difference of 0.39%), Salvadoran (14.0%, a difference of 0.41%), and Immigrants from Middle Africa (14.0%, a difference of 0.44%).
| Demographics | Rating | Rank | Poverty |
| French American Indians | 0.5 /100 | #237 | Tragic 13.9% |
| Ghanaians | 0.5 /100 | #238 | Tragic 13.9% |
| Nicaraguans | 0.4 /100 | #239 | Tragic 13.9% |
| Immigrants | Middle Africa | 0.4 /100 | #240 | Tragic 14.0% |
| Salvadorans | 0.4 /100 | #241 | Tragic 14.0% |
| Ecuadorians | 0.4 /100 | #242 | Tragic 14.0% |
| Sudanese | 0.3 /100 | #243 | Tragic 14.0% |
| Nepalese | 0.3 /100 | #244 | Tragic 14.0% |
| Immigrants | Sudan | 0.3 /100 | #245 | Tragic 14.1% |
| Potawatomi | 0.3 /100 | #246 | Tragic 14.1% |
| Liberians | 0.2 /100 | #247 | Tragic 14.1% |
| Immigrants | Western Africa | 0.2 /100 | #248 | Tragic 14.1% |
| Immigrants | Ghana | 0.2 /100 | #249 | Tragic 14.2% |
| Cree | 0.2 /100 | #250 | Tragic 14.2% |
| Immigrants | Burma/Myanmar | 0.2 /100 | #251 | Tragic 14.2% |