Immigrants from Lithuania vs Costa Rican Poverty
COMPARE
Immigrants from Lithuania
Costa Rican
Poverty
Poverty Comparison
Immigrants from Lithuania
Costa Ricans
10.3%
POVERTY
99.9/ 100
METRIC RATING
11th/ 347
METRIC RANK
12.2%
POVERTY
62.2/ 100
METRIC RATING
157th/ 347
METRIC RANK
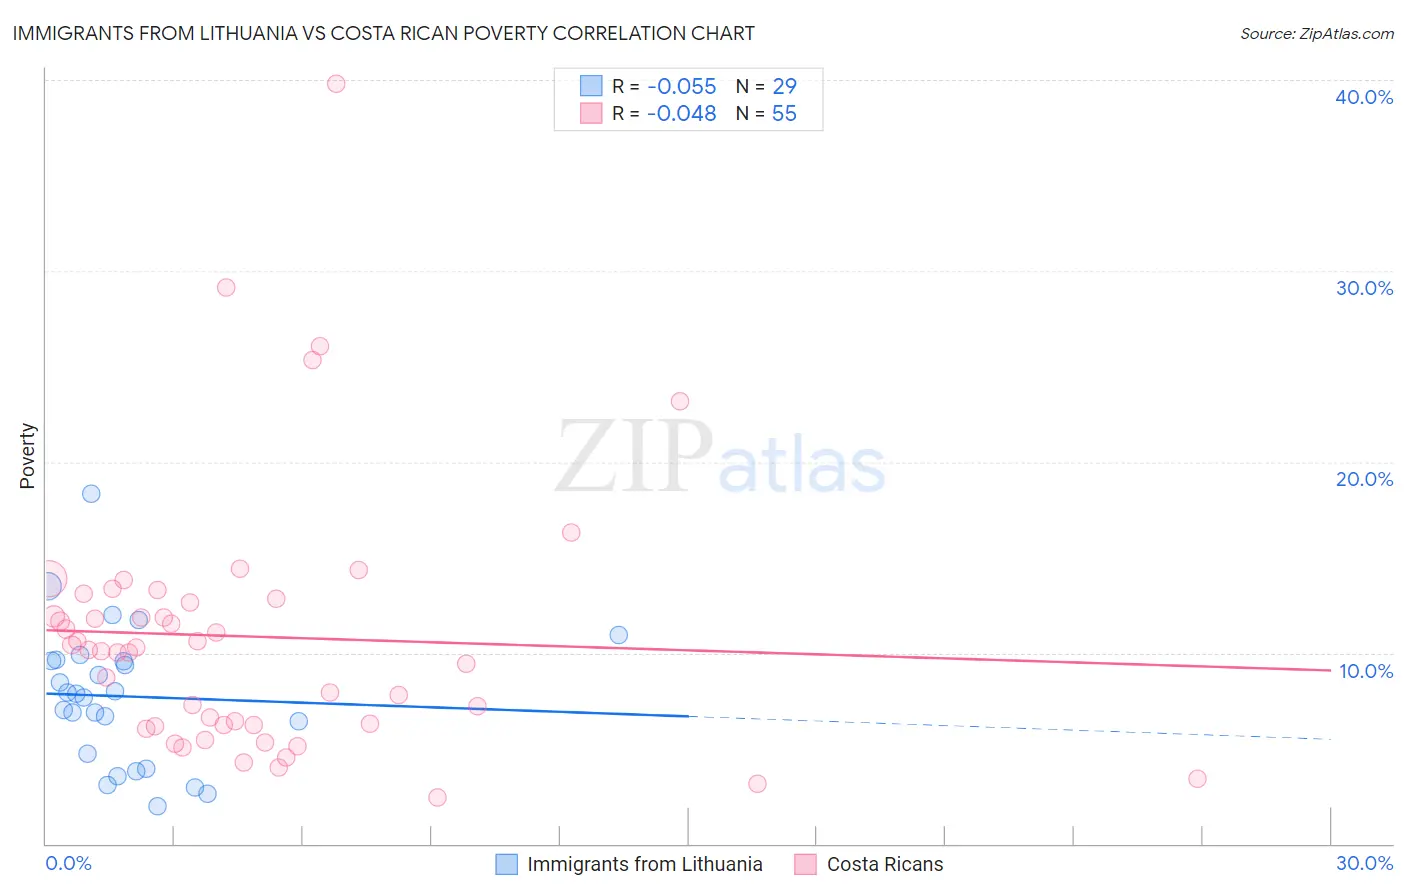
Immigrants from Lithuania vs Costa Rican Poverty Correlation Chart
The statistical analysis conducted on geographies consisting of 117,712,051 people shows a slight negative correlation between the proportion of Immigrants from Lithuania and poverty level in the United States with a correlation coefficient (R) of -0.055 and weighted average of 10.3%. Similarly, the statistical analysis conducted on geographies consisting of 253,487,550 people shows no correlation between the proportion of Costa Ricans and poverty level in the United States with a correlation coefficient (R) of -0.048 and weighted average of 12.2%, a difference of 17.6%.
Poverty Correlation Summary
| Measurement | Immigrants from Lithuania | Costa Rican |
| Minimum | 2.0% | 2.4% |
| Maximum | 18.3% | 39.8% |
| Range | 16.4% | 37.4% |
| Mean | 7.7% | 10.8% |
| Median | 7.9% | 10.2% |
| Interquartile 25% (IQ1) | 4.3% | 6.2% |
| Interquartile 75% (IQ3) | 9.6% | 12.8% |
| Interquartile Range (IQR) | 5.3% | 6.6% |
| Standard Deviation (Sample) | 3.7% | 6.9% |
| Standard Deviation (Population) | 3.6% | 6.8% |
Similar Demographics by Poverty
Demographics Similar to Immigrants from Lithuania by Poverty
In terms of poverty, the demographic groups most similar to Immigrants from Lithuania are Bhutanese (10.4%, a difference of 0.35%), Immigrants from Hong Kong (10.4%, a difference of 0.57%), Immigrants from Bolivia (10.4%, a difference of 0.89%), Bolivian (10.4%, a difference of 0.89%), and Bulgarian (10.2%, a difference of 0.99%).
| Demographics | Rating | Rank | Poverty |
| Immigrants | Taiwan | 100.0 /100 | #4 | Exceptional 9.7% |
| Immigrants | Ireland | 99.9 /100 | #5 | Exceptional 10.1% |
| Assyrians/Chaldeans/Syriacs | 99.9 /100 | #6 | Exceptional 10.1% |
| Filipinos | 99.9 /100 | #7 | Exceptional 10.1% |
| Maltese | 99.9 /100 | #8 | Exceptional 10.2% |
| Immigrants | South Central Asia | 99.9 /100 | #9 | Exceptional 10.2% |
| Bulgarians | 99.9 /100 | #10 | Exceptional 10.2% |
| Immigrants | Lithuania | 99.9 /100 | #11 | Exceptional 10.3% |
| Bhutanese | 99.8 /100 | #12 | Exceptional 10.4% |
| Immigrants | Hong Kong | 99.8 /100 | #13 | Exceptional 10.4% |
| Immigrants | Bolivia | 99.8 /100 | #14 | Exceptional 10.4% |
| Bolivians | 99.8 /100 | #15 | Exceptional 10.4% |
| Lithuanians | 99.8 /100 | #16 | Exceptional 10.5% |
| Norwegians | 99.8 /100 | #17 | Exceptional 10.5% |
| Latvians | 99.8 /100 | #18 | Exceptional 10.5% |
Demographics Similar to Costa Ricans by Poverty
In terms of poverty, the demographic groups most similar to Costa Ricans are Scotch-Irish (12.2%, a difference of 0.040%), Taiwanese (12.2%, a difference of 0.040%), Pennsylvania German (12.2%, a difference of 0.14%), Hungarian (12.2%, a difference of 0.15%), and Immigrants from Northern Africa (12.1%, a difference of 0.18%).
| Demographics | Rating | Rank | Poverty |
| Immigrants | Kazakhstan | 72.3 /100 | #150 | Good 12.0% |
| Samoans | 71.9 /100 | #151 | Good 12.0% |
| Armenians | 67.6 /100 | #152 | Good 12.1% |
| Immigrants | Northern Africa | 63.9 /100 | #153 | Good 12.1% |
| Guamanians/Chamorros | 63.9 /100 | #154 | Good 12.1% |
| Hungarians | 63.6 /100 | #155 | Good 12.2% |
| Scotch-Irish | 62.6 /100 | #156 | Good 12.2% |
| Costa Ricans | 62.2 /100 | #157 | Good 12.2% |
| Taiwanese | 61.8 /100 | #158 | Good 12.2% |
| Pennsylvania Germans | 60.8 /100 | #159 | Good 12.2% |
| Immigrants | Nepal | 60.4 /100 | #160 | Good 12.2% |
| Immigrants | Fiji | 59.1 /100 | #161 | Average 12.2% |
| Ethiopians | 59.1 /100 | #162 | Average 12.2% |
| Immigrants | Ethiopia | 58.6 /100 | #163 | Average 12.2% |
| Colombians | 57.8 /100 | #164 | Average 12.2% |