Immigrants from Sudan vs Costa Rican Poverty
COMPARE
Immigrants from Sudan
Costa Rican
Poverty
Poverty Comparison
Immigrants from Sudan
Costa Ricans
14.1%
POVERTY
0.3/ 100
METRIC RATING
245th/ 347
METRIC RANK
12.2%
POVERTY
62.2/ 100
METRIC RATING
157th/ 347
METRIC RANK
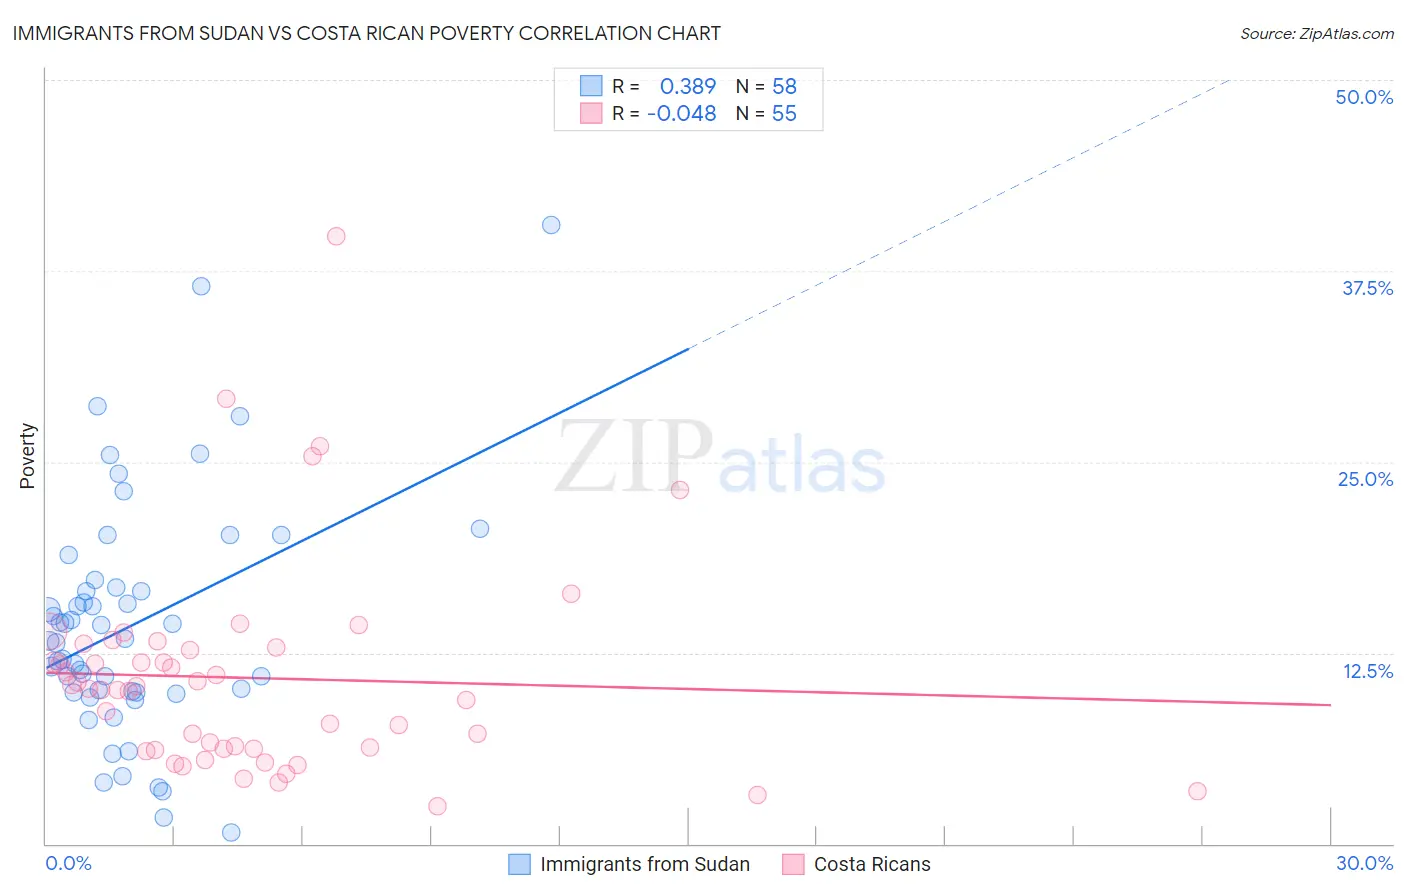
Immigrants from Sudan vs Costa Rican Poverty Correlation Chart
The statistical analysis conducted on geographies consisting of 118,962,035 people shows a mild positive correlation between the proportion of Immigrants from Sudan and poverty level in the United States with a correlation coefficient (R) of 0.389 and weighted average of 14.1%. Similarly, the statistical analysis conducted on geographies consisting of 253,487,550 people shows no correlation between the proportion of Costa Ricans and poverty level in the United States with a correlation coefficient (R) of -0.048 and weighted average of 12.2%, a difference of 15.6%.
Poverty Correlation Summary
| Measurement | Immigrants from Sudan | Costa Rican |
| Minimum | 0.75% | 2.4% |
| Maximum | 40.5% | 39.8% |
| Range | 39.8% | 37.4% |
| Mean | 14.3% | 10.8% |
| Median | 13.4% | 10.2% |
| Interquartile 25% (IQ1) | 9.9% | 6.2% |
| Interquartile 75% (IQ3) | 16.8% | 12.8% |
| Interquartile Range (IQR) | 6.9% | 6.6% |
| Standard Deviation (Sample) | 7.8% | 6.9% |
| Standard Deviation (Population) | 7.7% | 6.8% |
Similar Demographics by Poverty
Demographics Similar to Immigrants from Sudan by Poverty
In terms of poverty, the demographic groups most similar to Immigrants from Sudan are Potawatomi (14.1%, a difference of 0.20%), Nepalese (14.0%, a difference of 0.39%), Sudanese (14.0%, a difference of 0.42%), Liberian (14.1%, a difference of 0.48%), and Ecuadorian (14.0%, a difference of 0.49%).
| Demographics | Rating | Rank | Poverty |
| Ghanaians | 0.5 /100 | #238 | Tragic 13.9% |
| Nicaraguans | 0.4 /100 | #239 | Tragic 13.9% |
| Immigrants | Middle Africa | 0.4 /100 | #240 | Tragic 14.0% |
| Salvadorans | 0.4 /100 | #241 | Tragic 14.0% |
| Ecuadorians | 0.4 /100 | #242 | Tragic 14.0% |
| Sudanese | 0.3 /100 | #243 | Tragic 14.0% |
| Nepalese | 0.3 /100 | #244 | Tragic 14.0% |
| Immigrants | Sudan | 0.3 /100 | #245 | Tragic 14.1% |
| Potawatomi | 0.3 /100 | #246 | Tragic 14.1% |
| Liberians | 0.2 /100 | #247 | Tragic 14.1% |
| Immigrants | Western Africa | 0.2 /100 | #248 | Tragic 14.1% |
| Immigrants | Ghana | 0.2 /100 | #249 | Tragic 14.2% |
| Cree | 0.2 /100 | #250 | Tragic 14.2% |
| Immigrants | Burma/Myanmar | 0.2 /100 | #251 | Tragic 14.2% |
| Spanish American Indians | 0.2 /100 | #252 | Tragic 14.2% |
Demographics Similar to Costa Ricans by Poverty
In terms of poverty, the demographic groups most similar to Costa Ricans are Scotch-Irish (12.2%, a difference of 0.040%), Taiwanese (12.2%, a difference of 0.040%), Pennsylvania German (12.2%, a difference of 0.14%), Hungarian (12.2%, a difference of 0.15%), and Immigrants from Northern Africa (12.1%, a difference of 0.18%).
| Demographics | Rating | Rank | Poverty |
| Immigrants | Kazakhstan | 72.3 /100 | #150 | Good 12.0% |
| Samoans | 71.9 /100 | #151 | Good 12.0% |
| Armenians | 67.6 /100 | #152 | Good 12.1% |
| Immigrants | Northern Africa | 63.9 /100 | #153 | Good 12.1% |
| Guamanians/Chamorros | 63.9 /100 | #154 | Good 12.1% |
| Hungarians | 63.6 /100 | #155 | Good 12.2% |
| Scotch-Irish | 62.6 /100 | #156 | Good 12.2% |
| Costa Ricans | 62.2 /100 | #157 | Good 12.2% |
| Taiwanese | 61.8 /100 | #158 | Good 12.2% |
| Pennsylvania Germans | 60.8 /100 | #159 | Good 12.2% |
| Immigrants | Nepal | 60.4 /100 | #160 | Good 12.2% |
| Immigrants | Fiji | 59.1 /100 | #161 | Average 12.2% |
| Ethiopians | 59.1 /100 | #162 | Average 12.2% |
| Immigrants | Ethiopia | 58.6 /100 | #163 | Average 12.2% |
| Colombians | 57.8 /100 | #164 | Average 12.2% |