Immigrants from Sudan vs Immigrants from Nepal Median Household Income
COMPARE
Immigrants from Sudan
Immigrants from Nepal
Median Household Income
Median Household Income Comparison
Immigrants from Sudan
Immigrants from Nepal
$79,103
MEDIAN HOUSEHOLD INCOME
2.1/ 100
METRIC RATING
242nd/ 347
METRIC RANK
$87,046
MEDIAN HOUSEHOLD INCOME
77.7/ 100
METRIC RATING
149th/ 347
METRIC RANK
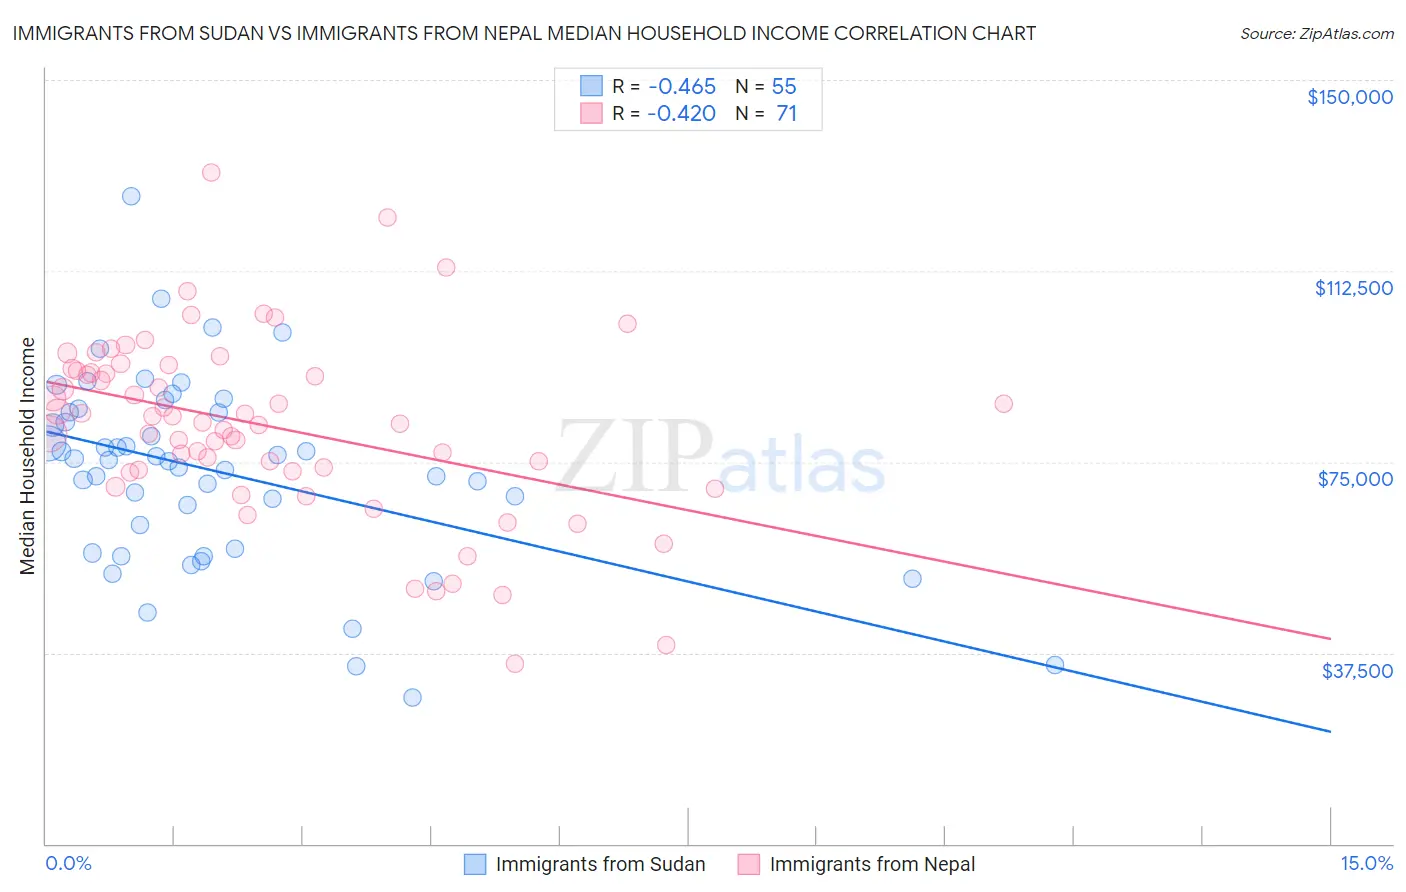
Immigrants from Sudan vs Immigrants from Nepal Median Household Income Correlation Chart
The statistical analysis conducted on geographies consisting of 118,931,999 people shows a moderate negative correlation between the proportion of Immigrants from Sudan and median household income in the United States with a correlation coefficient (R) of -0.465 and weighted average of $79,103. Similarly, the statistical analysis conducted on geographies consisting of 186,662,148 people shows a moderate negative correlation between the proportion of Immigrants from Nepal and median household income in the United States with a correlation coefficient (R) of -0.420 and weighted average of $87,046, a difference of 10.0%.
Median Household Income Correlation Summary
| Measurement | Immigrants from Sudan | Immigrants from Nepal |
| Minimum | $28,750 | $35,329 |
| Maximum | $127,214 | $131,777 |
| Range | $98,464 | $96,448 |
| Mean | $73,170 | $81,976 |
| Median | $75,325 | $82,737 |
| Interquartile 25% (IQ1) | $58,025 | $73,125 |
| Interquartile 75% (IQ3) | $84,793 | $92,873 |
| Interquartile Range (IQR) | $26,769 | $19,748 |
| Standard Deviation (Sample) | $18,620 | $17,803 |
| Standard Deviation (Population) | $18,450 | $17,677 |
Similar Demographics by Median Household Income
Demographics Similar to Immigrants from Sudan by Median Household Income
In terms of median household income, the demographic groups most similar to Immigrants from Sudan are Immigrants from Barbados ($78,989, a difference of 0.14%), Marshallese ($78,930, a difference of 0.22%), Inupiat ($78,841, a difference of 0.33%), Central American ($78,803, a difference of 0.38%), and Nonimmigrants ($79,429, a difference of 0.41%).
| Demographics | Rating | Rank | Median Household Income |
| Immigrants | Guyana | 4.5 /100 | #235 | Tragic $80,324 |
| Immigrants | Bosnia and Herzegovina | 3.4 /100 | #236 | Tragic $79,888 |
| Nicaraguans | 3.1 /100 | #237 | Tragic $79,737 |
| Barbadians | 3.0 /100 | #238 | Tragic $79,664 |
| Alaska Natives | 2.7 /100 | #239 | Tragic $79,509 |
| Immigrants | Western Africa | 2.7 /100 | #240 | Tragic $79,490 |
| Immigrants | Nonimmigrants | 2.6 /100 | #241 | Tragic $79,429 |
| Immigrants | Sudan | 2.1 /100 | #242 | Tragic $79,103 |
| Immigrants | Barbados | 1.9 /100 | #243 | Tragic $78,989 |
| Marshallese | 1.9 /100 | #244 | Tragic $78,930 |
| Inupiat | 1.8 /100 | #245 | Tragic $78,841 |
| Central Americans | 1.7 /100 | #246 | Tragic $78,803 |
| Immigrants | Burma/Myanmar | 1.6 /100 | #247 | Tragic $78,682 |
| Sudanese | 1.5 /100 | #248 | Tragic $78,529 |
| West Indians | 1.4 /100 | #249 | Tragic $78,455 |
Demographics Similar to Immigrants from Nepal by Median Household Income
In terms of median household income, the demographic groups most similar to Immigrants from Nepal are Basque ($87,001, a difference of 0.050%), Hungarian ($86,920, a difference of 0.15%), Immigrants from Saudi Arabia ($86,875, a difference of 0.20%), Costa Rican ($87,262, a difference of 0.25%), and South American ($86,824, a difference of 0.26%).
| Demographics | Rating | Rank | Median Household Income |
| Canadians | 84.7 /100 | #142 | Excellent $87,769 |
| Danes | 83.9 /100 | #143 | Excellent $87,676 |
| Serbians | 83.0 /100 | #144 | Excellent $87,572 |
| Ugandans | 82.9 /100 | #145 | Excellent $87,557 |
| Immigrants | Uganda | 82.8 /100 | #146 | Excellent $87,553 |
| South American Indians | 81.8 /100 | #147 | Excellent $87,446 |
| Costa Ricans | 80.0 /100 | #148 | Excellent $87,262 |
| Immigrants | Nepal | 77.7 /100 | #149 | Good $87,046 |
| Basques | 77.2 /100 | #150 | Good $87,001 |
| Hungarians | 76.3 /100 | #151 | Good $86,920 |
| Immigrants | Saudi Arabia | 75.8 /100 | #152 | Good $86,875 |
| South Americans | 75.1 /100 | #153 | Good $86,824 |
| Immigrants | Germany | 74.4 /100 | #154 | Good $86,764 |
| Carpatho Rusyns | 72.8 /100 | #155 | Good $86,635 |
| Immigrants | Albania | 71.5 /100 | #156 | Good $86,534 |