Immigrants from St. Vincent and the Grenadines vs Arapaho Poverty
COMPARE
Immigrants from St. Vincent and the Grenadines
Arapaho
Poverty
Poverty Comparison
Immigrants from St. Vincent and the Grenadines
Arapaho
14.9%
POVERTY
0.0/ 100
METRIC RATING
279th/ 347
METRIC RANK
16.3%
POVERTY
0.0/ 100
METRIC RATING
321st/ 347
METRIC RANK
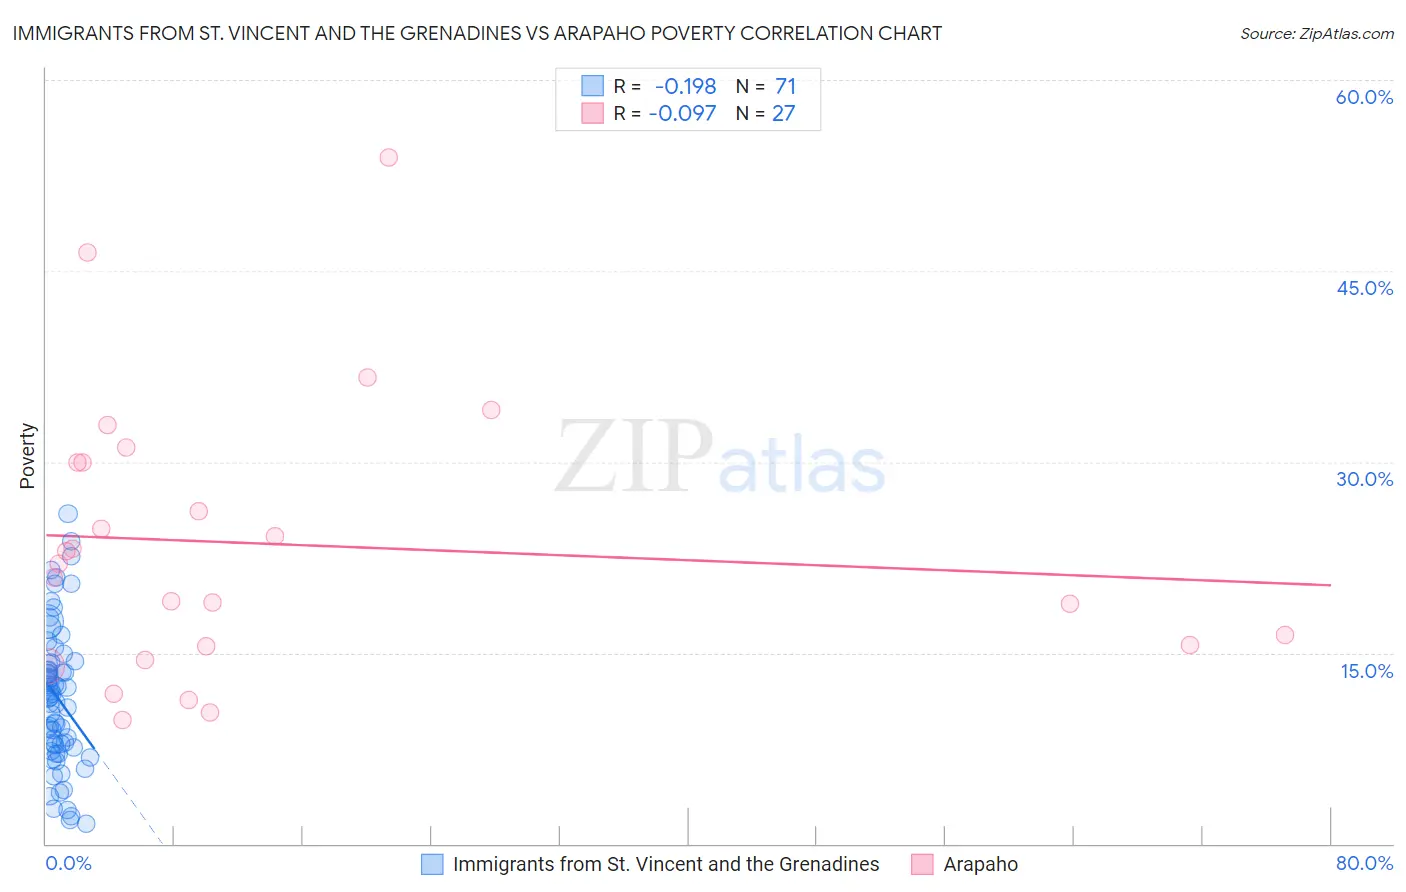
Immigrants from St. Vincent and the Grenadines vs Arapaho Poverty Correlation Chart
The statistical analysis conducted on geographies consisting of 56,091,353 people shows a poor negative correlation between the proportion of Immigrants from St. Vincent and the Grenadines and poverty level in the United States with a correlation coefficient (R) of -0.198 and weighted average of 14.9%. Similarly, the statistical analysis conducted on geographies consisting of 29,778,572 people shows a slight negative correlation between the proportion of Arapaho and poverty level in the United States with a correlation coefficient (R) of -0.097 and weighted average of 16.3%, a difference of 9.6%.
Poverty Correlation Summary
| Measurement | Immigrants from St. Vincent and the Grenadines | Arapaho |
| Minimum | 1.6% | 9.8% |
| Maximum | 25.9% | 53.9% |
| Range | 24.3% | 44.2% |
| Mean | 11.5% | 23.5% |
| Median | 11.5% | 22.0% |
| Interquartile 25% (IQ1) | 7.5% | 15.5% |
| Interquartile 75% (IQ3) | 14.2% | 30.0% |
| Interquartile Range (IQR) | 6.7% | 14.4% |
| Standard Deviation (Sample) | 5.5% | 10.8% |
| Standard Deviation (Population) | 5.5% | 10.6% |
Similar Demographics by Poverty
Demographics Similar to Immigrants from St. Vincent and the Grenadines by Poverty
In terms of poverty, the demographic groups most similar to Immigrants from St. Vincent and the Grenadines are Haitian (14.9%, a difference of 0.20%), Immigrants from Barbados (14.9%, a difference of 0.27%), Belizean (14.8%, a difference of 0.29%), Bangladeshi (14.8%, a difference of 0.31%), and Immigrants from West Indies (14.8%, a difference of 0.37%).
| Demographics | Rating | Rank | Poverty |
| Chickasaw | 0.0 /100 | #272 | Tragic 14.7% |
| Spanish Americans | 0.0 /100 | #273 | Tragic 14.7% |
| Barbadians | 0.0 /100 | #274 | Tragic 14.8% |
| Immigrants | West Indies | 0.0 /100 | #275 | Tragic 14.8% |
| Immigrants | Bahamas | 0.0 /100 | #276 | Tragic 14.8% |
| Bangladeshis | 0.0 /100 | #277 | Tragic 14.8% |
| Belizeans | 0.0 /100 | #278 | Tragic 14.8% |
| Immigrants | St. Vincent and the Grenadines | 0.0 /100 | #279 | Tragic 14.9% |
| Haitians | 0.0 /100 | #280 | Tragic 14.9% |
| Immigrants | Barbados | 0.0 /100 | #281 | Tragic 14.9% |
| Comanche | 0.0 /100 | #282 | Tragic 15.0% |
| Immigrants | Haiti | 0.0 /100 | #283 | Tragic 15.0% |
| West Indians | 0.0 /100 | #284 | Tragic 15.0% |
| Vietnamese | 0.0 /100 | #285 | Tragic 15.0% |
| Immigrants | Latin America | 0.0 /100 | #286 | Tragic 15.0% |
Demographics Similar to Arapaho by Poverty
In terms of poverty, the demographic groups most similar to Arapaho are Immigrants from Honduras (16.2%, a difference of 0.74%), Menominee (16.4%, a difference of 0.96%), Immigrants from Congo (16.1%, a difference of 0.97%), Immigrants from Dominica (16.1%, a difference of 1.2%), and U.S. Virgin Islander (16.1%, a difference of 1.5%).
| Demographics | Rating | Rank | Poverty |
| Immigrants | Somalia | 0.0 /100 | #314 | Tragic 15.8% |
| British West Indians | 0.0 /100 | #315 | Tragic 15.9% |
| Hondurans | 0.0 /100 | #316 | Tragic 15.9% |
| U.S. Virgin Islanders | 0.0 /100 | #317 | Tragic 16.1% |
| Immigrants | Dominica | 0.0 /100 | #318 | Tragic 16.1% |
| Immigrants | Congo | 0.0 /100 | #319 | Tragic 16.1% |
| Immigrants | Honduras | 0.0 /100 | #320 | Tragic 16.2% |
| Arapaho | 0.0 /100 | #321 | Tragic 16.3% |
| Menominee | 0.0 /100 | #322 | Tragic 16.4% |
| Colville | 0.0 /100 | #323 | Tragic 16.6% |
| Yakama | 0.0 /100 | #324 | Tragic 16.7% |
| Central American Indians | 0.0 /100 | #325 | Tragic 16.7% |
| Paiute | 0.0 /100 | #326 | Tragic 16.7% |
| Kiowa | 0.0 /100 | #327 | Tragic 16.8% |
| Ute | 0.0 /100 | #328 | Tragic 16.9% |