Immigrants from South America vs Eastern European Master's Degree
COMPARE
Immigrants from South America
Eastern European
Master's Degree
Master's Degree Comparison
Immigrants from South America
Eastern Europeans
15.5%
MASTER'S DEGREE
76.3/ 100
METRIC RATING
154th/ 347
METRIC RANK
21.1%
MASTER'S DEGREE
100.0/ 100
METRIC RATING
12th/ 347
METRIC RANK
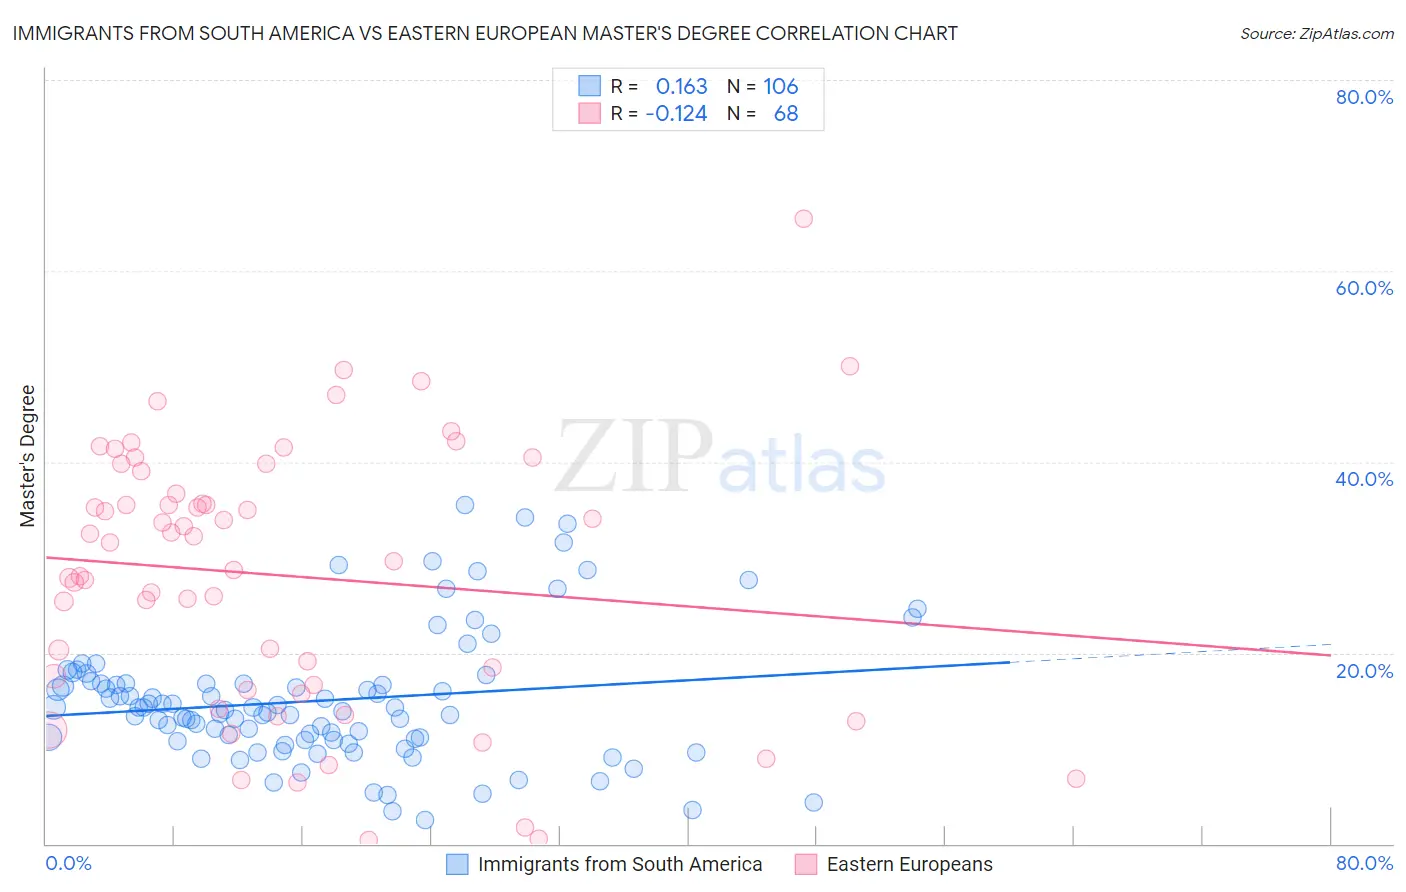
Immigrants from South America vs Eastern European Master's Degree Correlation Chart
The statistical analysis conducted on geographies consisting of 486,157,509 people shows a poor positive correlation between the proportion of Immigrants from South America and percentage of population with at least master's degree education in the United States with a correlation coefficient (R) of 0.163 and weighted average of 15.5%. Similarly, the statistical analysis conducted on geographies consisting of 461,097,152 people shows a poor negative correlation between the proportion of Eastern Europeans and percentage of population with at least master's degree education in the United States with a correlation coefficient (R) of -0.124 and weighted average of 21.1%, a difference of 36.4%.
Master's Degree Correlation Summary
| Measurement | Immigrants from South America | Eastern European |
| Minimum | 2.5% | 0.34% |
| Maximum | 35.5% | 65.5% |
| Range | 33.0% | 65.2% |
| Mean | 15.0% | 28.1% |
| Median | 14.1% | 30.6% |
| Interquartile 25% (IQ1) | 10.9% | 16.4% |
| Interquartile 75% (IQ3) | 16.8% | 37.8% |
| Interquartile Range (IQR) | 5.9% | 21.4% |
| Standard Deviation (Sample) | 6.8% | 13.9% |
| Standard Deviation (Population) | 6.8% | 13.8% |
Similar Demographics by Master's Degree
Demographics Similar to Immigrants from South America by Master's Degree
In terms of master's degree, the demographic groups most similar to Immigrants from South America are Immigrants from Bangladesh (15.5%, a difference of 0.040%), Icelander (15.5%, a difference of 0.090%), Slavic (15.5%, a difference of 0.12%), Iraqi (15.5%, a difference of 0.17%), and Slovene (15.5%, a difference of 0.29%).
| Demographics | Rating | Rank | Master's Degree |
| Hungarians | 79.1 /100 | #147 | Good 15.6% |
| Immigrants | Senegal | 78.2 /100 | #148 | Good 15.5% |
| Ghanaians | 78.2 /100 | #149 | Good 15.5% |
| Slovenes | 78.0 /100 | #150 | Good 15.5% |
| Iraqis | 77.3 /100 | #151 | Good 15.5% |
| Slavs | 77.0 /100 | #152 | Good 15.5% |
| Icelanders | 76.8 /100 | #153 | Good 15.5% |
| Immigrants | South America | 76.3 /100 | #154 | Good 15.5% |
| Immigrants | Bangladesh | 76.1 /100 | #155 | Good 15.5% |
| Bermudans | 73.9 /100 | #156 | Good 15.4% |
| Immigrants | Cameroon | 71.7 /100 | #157 | Good 15.4% |
| Immigrants | Poland | 71.5 /100 | #158 | Good 15.4% |
| Luxembourgers | 71.0 /100 | #159 | Good 15.3% |
| Kenyans | 70.3 /100 | #160 | Good 15.3% |
| Sudanese | 68.7 /100 | #161 | Good 15.3% |
Demographics Similar to Eastern Europeans by Master's Degree
In terms of master's degree, the demographic groups most similar to Eastern Europeans are Immigrants from China (21.2%, a difference of 0.32%), Immigrants from Australia (20.9%, a difference of 1.2%), Immigrants from Switzerland (20.9%, a difference of 1.2%), Immigrants from Eastern Asia (20.8%, a difference of 1.4%), and Immigrants from Belgium (20.8%, a difference of 1.7%).
| Demographics | Rating | Rank | Master's Degree |
| Immigrants | Taiwan | 100.0 /100 | #5 | Exceptional 22.5% |
| Immigrants | India | 100.0 /100 | #6 | Exceptional 22.3% |
| Iranians | 100.0 /100 | #7 | Exceptional 22.3% |
| Cypriots | 100.0 /100 | #8 | Exceptional 21.8% |
| Thais | 100.0 /100 | #9 | Exceptional 21.7% |
| Immigrants | Iran | 100.0 /100 | #10 | Exceptional 21.6% |
| Immigrants | China | 100.0 /100 | #11 | Exceptional 21.2% |
| Eastern Europeans | 100.0 /100 | #12 | Exceptional 21.1% |
| Immigrants | Australia | 100.0 /100 | #13 | Exceptional 20.9% |
| Immigrants | Switzerland | 100.0 /100 | #14 | Exceptional 20.9% |
| Immigrants | Eastern Asia | 100.0 /100 | #15 | Exceptional 20.8% |
| Immigrants | Belgium | 100.0 /100 | #16 | Exceptional 20.8% |
| Immigrants | South Central Asia | 100.0 /100 | #17 | Exceptional 20.7% |
| Soviet Union | 100.0 /100 | #18 | Exceptional 20.5% |
| Immigrants | Hong Kong | 100.0 /100 | #19 | Exceptional 20.5% |