Immigrants from South America vs Scandinavian Single Female Poverty
COMPARE
Immigrants from South America
Scandinavian
Single Female Poverty
Single Female Poverty Comparison
Immigrants from South America
Scandinavians
20.0%
SINGLE FEMALE POVERTY
95.0/ 100
METRIC RATING
122nd/ 347
METRIC RANK
21.1%
SINGLE FEMALE POVERTY
45.2/ 100
METRIC RATING
177th/ 347
METRIC RANK
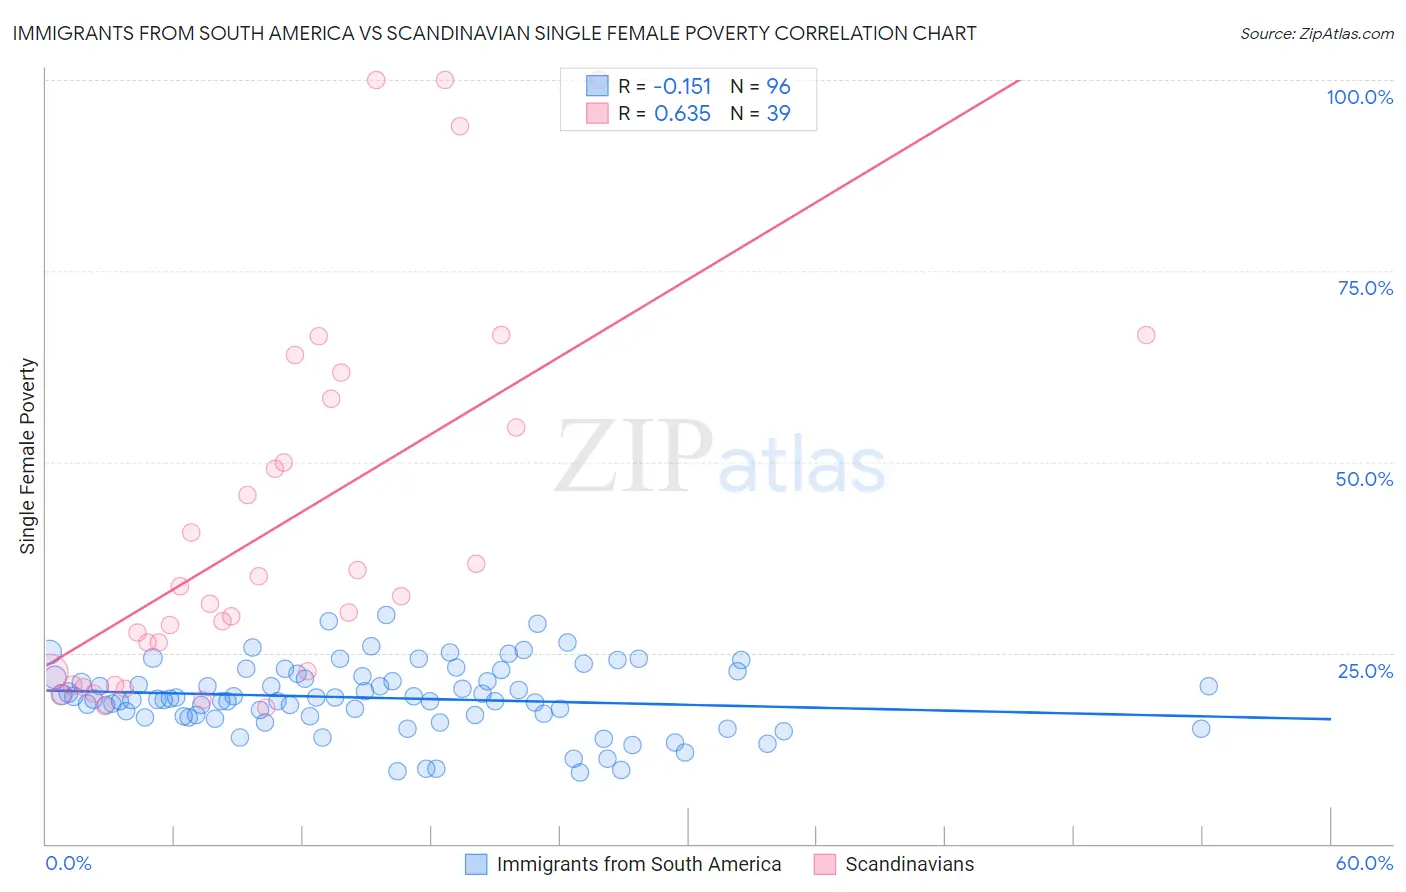
Immigrants from South America vs Scandinavian Single Female Poverty Correlation Chart
The statistical analysis conducted on geographies consisting of 475,439,671 people shows a poor negative correlation between the proportion of Immigrants from South America and poverty level among single females in the United States with a correlation coefficient (R) of -0.151 and weighted average of 20.0%. Similarly, the statistical analysis conducted on geographies consisting of 461,288,786 people shows a significant positive correlation between the proportion of Scandinavians and poverty level among single females in the United States with a correlation coefficient (R) of 0.635 and weighted average of 21.1%, a difference of 5.1%.
Single Female Poverty Correlation Summary
| Measurement | Immigrants from South America | Scandinavian |
| Minimum | 9.4% | 17.8% |
| Maximum | 30.0% | 100.0% |
| Range | 20.6% | 82.2% |
| Mean | 19.1% | 42.1% |
| Median | 19.0% | 32.4% |
| Interquartile 25% (IQ1) | 16.6% | 22.3% |
| Interquartile 75% (IQ3) | 21.9% | 58.3% |
| Interquartile Range (IQR) | 5.2% | 36.0% |
| Standard Deviation (Sample) | 4.4% | 24.6% |
| Standard Deviation (Population) | 4.4% | 24.3% |
Similar Demographics by Single Female Poverty
Demographics Similar to Immigrants from South America by Single Female Poverty
In terms of single female poverty, the demographic groups most similar to Immigrants from South America are Immigrants from Switzerland (20.0%, a difference of 0.030%), South American (20.0%, a difference of 0.060%), Immigrants from Afghanistan (20.0%, a difference of 0.16%), Immigrants from Ethiopia (20.0%, a difference of 0.16%), and Brazilian (20.1%, a difference of 0.18%).
| Demographics | Rating | Rank | Single Female Poverty |
| Immigrants | Northern Africa | 95.8 /100 | #115 | Exceptional 20.0% |
| Immigrants | Kazakhstan | 95.7 /100 | #116 | Exceptional 20.0% |
| Poles | 95.6 /100 | #117 | Exceptional 20.0% |
| Immigrants | Afghanistan | 95.4 /100 | #118 | Exceptional 20.0% |
| Immigrants | Ethiopia | 95.4 /100 | #119 | Exceptional 20.0% |
| South Americans | 95.1 /100 | #120 | Exceptional 20.0% |
| Immigrants | Switzerland | 95.1 /100 | #121 | Exceptional 20.0% |
| Immigrants | South America | 95.0 /100 | #122 | Exceptional 20.0% |
| Brazilians | 94.4 /100 | #123 | Exceptional 20.1% |
| Immigrants | Chile | 94.3 /100 | #124 | Exceptional 20.1% |
| Immigrants | South Africa | 93.9 /100 | #125 | Exceptional 20.1% |
| Serbians | 93.3 /100 | #126 | Exceptional 20.1% |
| Mongolians | 93.2 /100 | #127 | Exceptional 20.2% |
| Immigrants | Spain | 92.7 /100 | #128 | Exceptional 20.2% |
| Immigrants | Morocco | 92.4 /100 | #129 | Exceptional 20.2% |
Demographics Similar to Scandinavians by Single Female Poverty
In terms of single female poverty, the demographic groups most similar to Scandinavians are Canadian (21.1%, a difference of 0.010%), Immigrants from Bosnia and Herzegovina (21.1%, a difference of 0.020%), Czech (21.0%, a difference of 0.10%), British (21.1%, a difference of 0.14%), and Spanish American Indian (21.1%, a difference of 0.17%).
| Demographics | Rating | Rank | Single Female Poverty |
| New Zealanders | 53.2 /100 | #170 | Average 21.0% |
| Moroccans | 52.8 /100 | #171 | Average 21.0% |
| Guyanese | 52.0 /100 | #172 | Average 21.0% |
| Immigrants | Guyana | 50.6 /100 | #173 | Average 21.0% |
| Cubans | 50.0 /100 | #174 | Average 21.0% |
| Czechs | 46.8 /100 | #175 | Average 21.0% |
| Canadians | 45.4 /100 | #176 | Average 21.1% |
| Scandinavians | 45.2 /100 | #177 | Average 21.1% |
| Immigrants | Bosnia and Herzegovina | 44.9 /100 | #178 | Average 21.1% |
| British | 42.9 /100 | #179 | Average 21.1% |
| Spanish American Indians | 42.5 /100 | #180 | Average 21.1% |
| Europeans | 42.3 /100 | #181 | Average 21.1% |
| Slavs | 40.5 /100 | #182 | Average 21.1% |
| Slovaks | 39.7 /100 | #183 | Fair 21.1% |
| Hungarians | 39.6 /100 | #184 | Fair 21.1% |