Immigrants from Somalia vs Tlingit-Haida Single Female Poverty
COMPARE
Immigrants from Somalia
Tlingit-Haida
Single Female Poverty
Single Female Poverty Comparison
Immigrants from Somalia
Tlingit-Haida
25.8%
SINGLE FEMALE POVERTY
0.0/ 100
METRIC RATING
316th/ 347
METRIC RANK
21.9%
SINGLE FEMALE POVERTY
5.4/ 100
METRIC RATING
229th/ 347
METRIC RANK
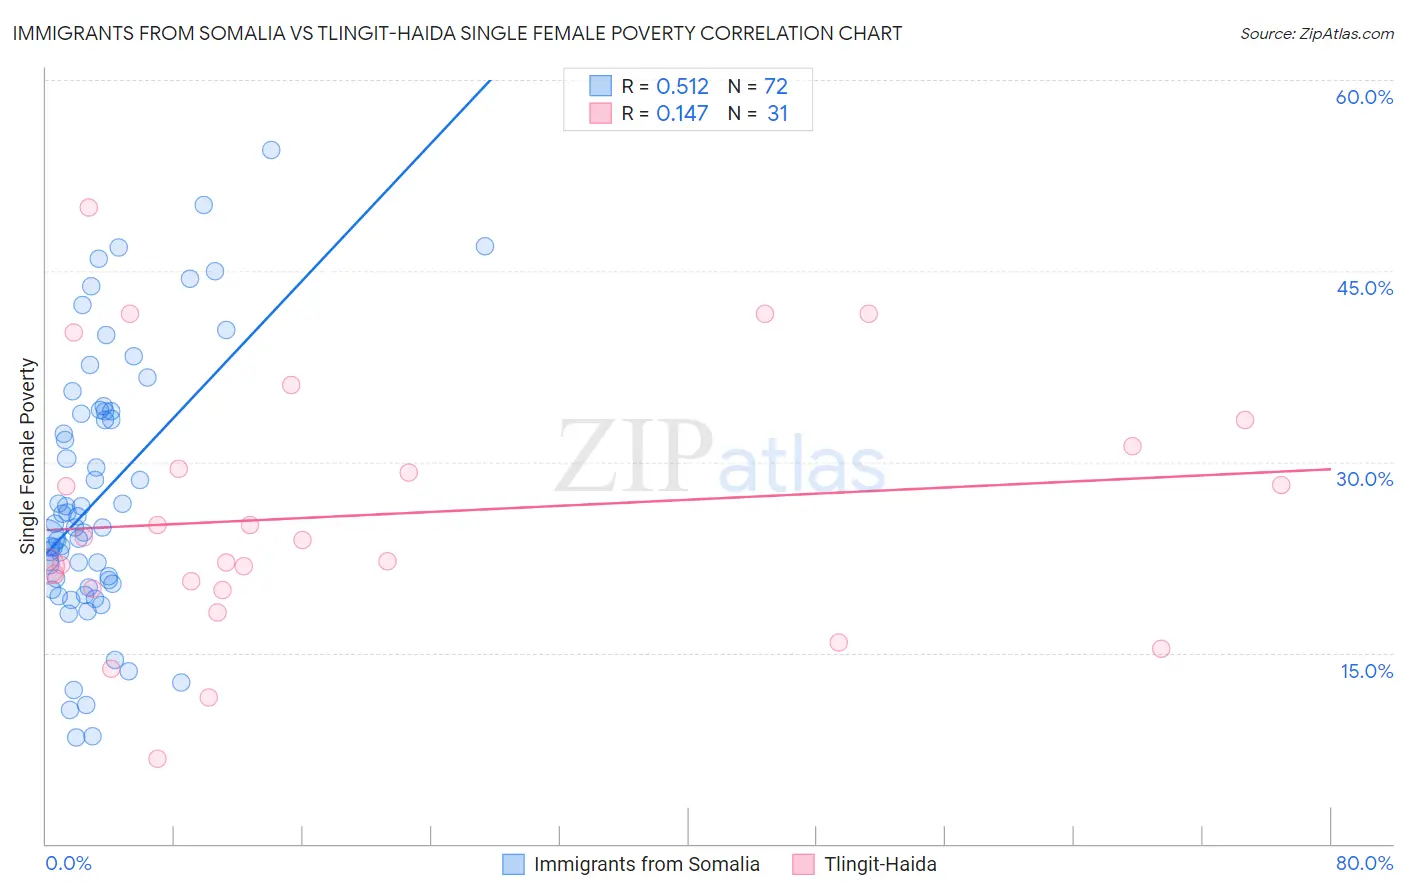
Immigrants from Somalia vs Tlingit-Haida Single Female Poverty Correlation Chart
The statistical analysis conducted on geographies consisting of 91,892,482 people shows a substantial positive correlation between the proportion of Immigrants from Somalia and poverty level among single females in the United States with a correlation coefficient (R) of 0.512 and weighted average of 25.8%. Similarly, the statistical analysis conducted on geographies consisting of 60,536,912 people shows a poor positive correlation between the proportion of Tlingit-Haida and poverty level among single females in the United States with a correlation coefficient (R) of 0.147 and weighted average of 21.9%, a difference of 17.5%.
Single Female Poverty Correlation Summary
| Measurement | Immigrants from Somalia | Tlingit-Haida |
| Minimum | 8.3% | 6.7% |
| Maximum | 54.5% | 50.0% |
| Range | 46.2% | 43.3% |
| Mean | 27.4% | 25.9% |
| Median | 25.0% | 23.9% |
| Interquartile 25% (IQ1) | 20.6% | 20.0% |
| Interquartile 75% (IQ3) | 34.0% | 31.2% |
| Interquartile Range (IQR) | 13.4% | 11.2% |
| Standard Deviation (Sample) | 10.4% | 9.9% |
| Standard Deviation (Population) | 10.3% | 9.8% |
Similar Demographics by Single Female Poverty
Demographics Similar to Immigrants from Somalia by Single Female Poverty
In terms of single female poverty, the demographic groups most similar to Immigrants from Somalia are Iroquois (25.7%, a difference of 0.15%), Cherokee (25.7%, a difference of 0.47%), Comanche (25.6%, a difference of 0.83%), Ottawa (26.0%, a difference of 0.84%), and Paiute (25.5%, a difference of 0.94%).
| Demographics | Rating | Rank | Single Female Poverty |
| Dominicans | 0.0 /100 | #309 | Tragic 25.4% |
| Central American Indians | 0.0 /100 | #310 | Tragic 25.5% |
| Immigrants | Honduras | 0.0 /100 | #311 | Tragic 25.5% |
| Paiute | 0.0 /100 | #312 | Tragic 25.5% |
| Comanche | 0.0 /100 | #313 | Tragic 25.6% |
| Cherokee | 0.0 /100 | #314 | Tragic 25.7% |
| Iroquois | 0.0 /100 | #315 | Tragic 25.7% |
| Immigrants | Somalia | 0.0 /100 | #316 | Tragic 25.8% |
| Ottawa | 0.0 /100 | #317 | Tragic 26.0% |
| Chickasaw | 0.0 /100 | #318 | Tragic 26.3% |
| Blacks/African Americans | 0.0 /100 | #319 | Tragic 26.4% |
| Arapaho | 0.0 /100 | #320 | Tragic 26.4% |
| Yup'ik | 0.0 /100 | #321 | Tragic 26.6% |
| Seminole | 0.0 /100 | #322 | Tragic 26.8% |
| Chippewa | 0.0 /100 | #323 | Tragic 26.8% |
Demographics Similar to Tlingit-Haida by Single Female Poverty
In terms of single female poverty, the demographic groups most similar to Tlingit-Haida are Immigrants from Western Africa (22.0%, a difference of 0.020%), Salvadoran (21.9%, a difference of 0.030%), Welsh (22.0%, a difference of 0.11%), Immigrants from Ghana (21.9%, a difference of 0.12%), and Immigrants from Thailand (22.0%, a difference of 0.12%).
| Demographics | Rating | Rank | Single Female Poverty |
| Immigrants | Eritrea | 7.9 /100 | #222 | Tragic 21.8% |
| Scottish | 7.3 /100 | #223 | Tragic 21.8% |
| Barbadians | 7.2 /100 | #224 | Tragic 21.8% |
| English | 6.4 /100 | #225 | Tragic 21.9% |
| Immigrants | Portugal | 5.8 /100 | #226 | Tragic 21.9% |
| Immigrants | Ghana | 5.8 /100 | #227 | Tragic 21.9% |
| Salvadorans | 5.5 /100 | #228 | Tragic 21.9% |
| Tlingit-Haida | 5.4 /100 | #229 | Tragic 21.9% |
| Immigrants | Western Africa | 5.3 /100 | #230 | Tragic 22.0% |
| Welsh | 5.0 /100 | #231 | Tragic 22.0% |
| Immigrants | Thailand | 5.0 /100 | #232 | Tragic 22.0% |
| Spaniards | 4.7 /100 | #233 | Tragic 22.0% |
| Spanish | 4.7 /100 | #234 | Tragic 22.0% |
| Dutch | 4.6 /100 | #235 | Tragic 22.0% |
| Immigrants | Ecuador | 4.2 /100 | #236 | Tragic 22.0% |