Immigrants from Somalia vs Tlingit-Haida Births to Unmarried Women
COMPARE
Immigrants from Somalia
Tlingit-Haida
Births to Unmarried Women
Births to Unmarried Women Comparison
Immigrants from Somalia
Tlingit-Haida
31.4%
BIRTHS TO UNMARRIED WOMEN
58.1/ 100
METRIC RATING
165th/ 347
METRIC RANK
32.2%
BIRTHS TO UNMARRIED WOMEN
32.6/ 100
METRIC RATING
190th/ 347
METRIC RANK
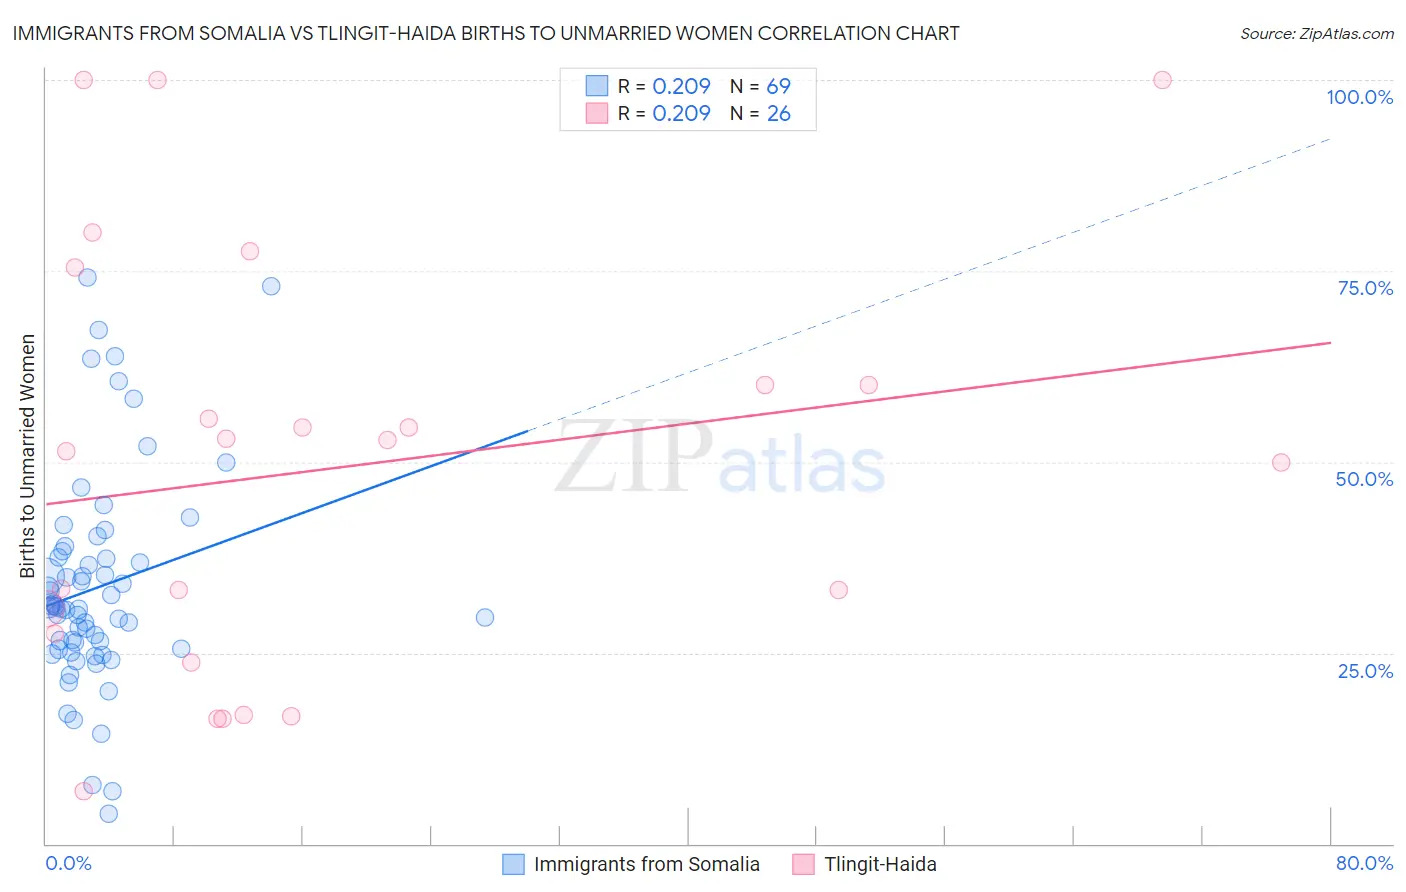
Immigrants from Somalia vs Tlingit-Haida Births to Unmarried Women Correlation Chart
The statistical analysis conducted on geographies consisting of 90,738,238 people shows a weak positive correlation between the proportion of Immigrants from Somalia and percentage of births to unmarried women in the United States with a correlation coefficient (R) of 0.209 and weighted average of 31.4%. Similarly, the statistical analysis conducted on geographies consisting of 59,376,059 people shows a weak positive correlation between the proportion of Tlingit-Haida and percentage of births to unmarried women in the United States with a correlation coefficient (R) of 0.209 and weighted average of 32.2%, a difference of 2.5%.
Births to Unmarried Women Correlation Summary
| Measurement | Immigrants from Somalia | Tlingit-Haida |
| Minimum | 4.0% | 6.9% |
| Maximum | 74.1% | 100.0% |
| Range | 70.1% | 93.1% |
| Mean | 33.6% | 49.2% |
| Median | 30.9% | 52.2% |
| Interquartile 25% (IQ1) | 25.5% | 27.6% |
| Interquartile 75% (IQ3) | 37.8% | 60.0% |
| Interquartile Range (IQR) | 12.3% | 32.4% |
| Standard Deviation (Sample) | 14.1% | 27.4% |
| Standard Deviation (Population) | 14.0% | 26.9% |
Similar Demographics by Births to Unmarried Women
Demographics Similar to Immigrants from Somalia by Births to Unmarried Women
In terms of births to unmarried women, the demographic groups most similar to Immigrants from Somalia are Peruvian (31.5%, a difference of 0.25%), Dutch (31.5%, a difference of 0.28%), Belgian (31.6%, a difference of 0.55%), Slavic (31.6%, a difference of 0.59%), and Hungarian (31.2%, a difference of 0.60%).
| Demographics | Rating | Rank | Births to Unmarried Women |
| Austrians | 69.9 /100 | #158 | Good 31.0% |
| Immigrants | England | 69.4 /100 | #159 | Good 31.1% |
| Immigrants | Western Europe | 69.3 /100 | #160 | Good 31.1% |
| Immigrants | Southern Europe | 68.7 /100 | #161 | Good 31.1% |
| Slovenes | 65.9 /100 | #162 | Good 31.2% |
| Immigrants | Chile | 65.7 /100 | #163 | Good 31.2% |
| Hungarians | 64.1 /100 | #164 | Good 31.2% |
| Immigrants | Somalia | 58.1 /100 | #165 | Average 31.4% |
| Peruvians | 55.5 /100 | #166 | Average 31.5% |
| Dutch | 55.3 /100 | #167 | Average 31.5% |
| Belgians | 52.4 /100 | #168 | Average 31.6% |
| Slavs | 52.0 /100 | #169 | Average 31.6% |
| Guamanians/Chamorros | 51.3 /100 | #170 | Average 31.6% |
| Finns | 50.5 /100 | #171 | Average 31.7% |
| Immigrants | Eritrea | 50.4 /100 | #172 | Average 31.7% |
Demographics Similar to Tlingit-Haida by Births to Unmarried Women
In terms of births to unmarried women, the demographic groups most similar to Tlingit-Haida are Irish (32.2%, a difference of 0.020%), Colombian (32.2%, a difference of 0.080%), Fijian (32.3%, a difference of 0.17%), Immigrants from Kenya (32.1%, a difference of 0.44%), and Osage (32.1%, a difference of 0.47%).
| Demographics | Rating | Rank | Births to Unmarried Women |
| Canadians | 41.4 /100 | #183 | Average 31.9% |
| Immigrants | South America | 40.7 /100 | #184 | Average 32.0% |
| Germans | 39.5 /100 | #185 | Fair 32.0% |
| Welsh | 38.2 /100 | #186 | Fair 32.0% |
| Czechoslovakians | 38.0 /100 | #187 | Fair 32.0% |
| Osage | 37.1 /100 | #188 | Fair 32.1% |
| Immigrants | Kenya | 36.9 /100 | #189 | Fair 32.1% |
| Tlingit-Haida | 32.6 /100 | #190 | Fair 32.2% |
| Irish | 32.4 /100 | #191 | Fair 32.2% |
| Colombians | 31.9 /100 | #192 | Fair 32.2% |
| Fijians | 31.1 /100 | #193 | Fair 32.3% |
| Sudanese | 27.3 /100 | #194 | Fair 32.4% |
| Samoans | 21.9 /100 | #195 | Fair 32.6% |
| Immigrants | Colombia | 21.7 /100 | #196 | Fair 32.6% |
| Immigrants | Immigrants | 20.6 /100 | #197 | Fair 32.7% |