Immigrants from Brazil vs Tlingit-Haida Single Female Poverty
COMPARE
Immigrants from Brazil
Tlingit-Haida
Single Female Poverty
Single Female Poverty Comparison
Immigrants from Brazil
Tlingit-Haida
19.7%
SINGLE FEMALE POVERTY
98.2/ 100
METRIC RATING
96th/ 347
METRIC RANK
21.9%
SINGLE FEMALE POVERTY
5.4/ 100
METRIC RATING
229th/ 347
METRIC RANK
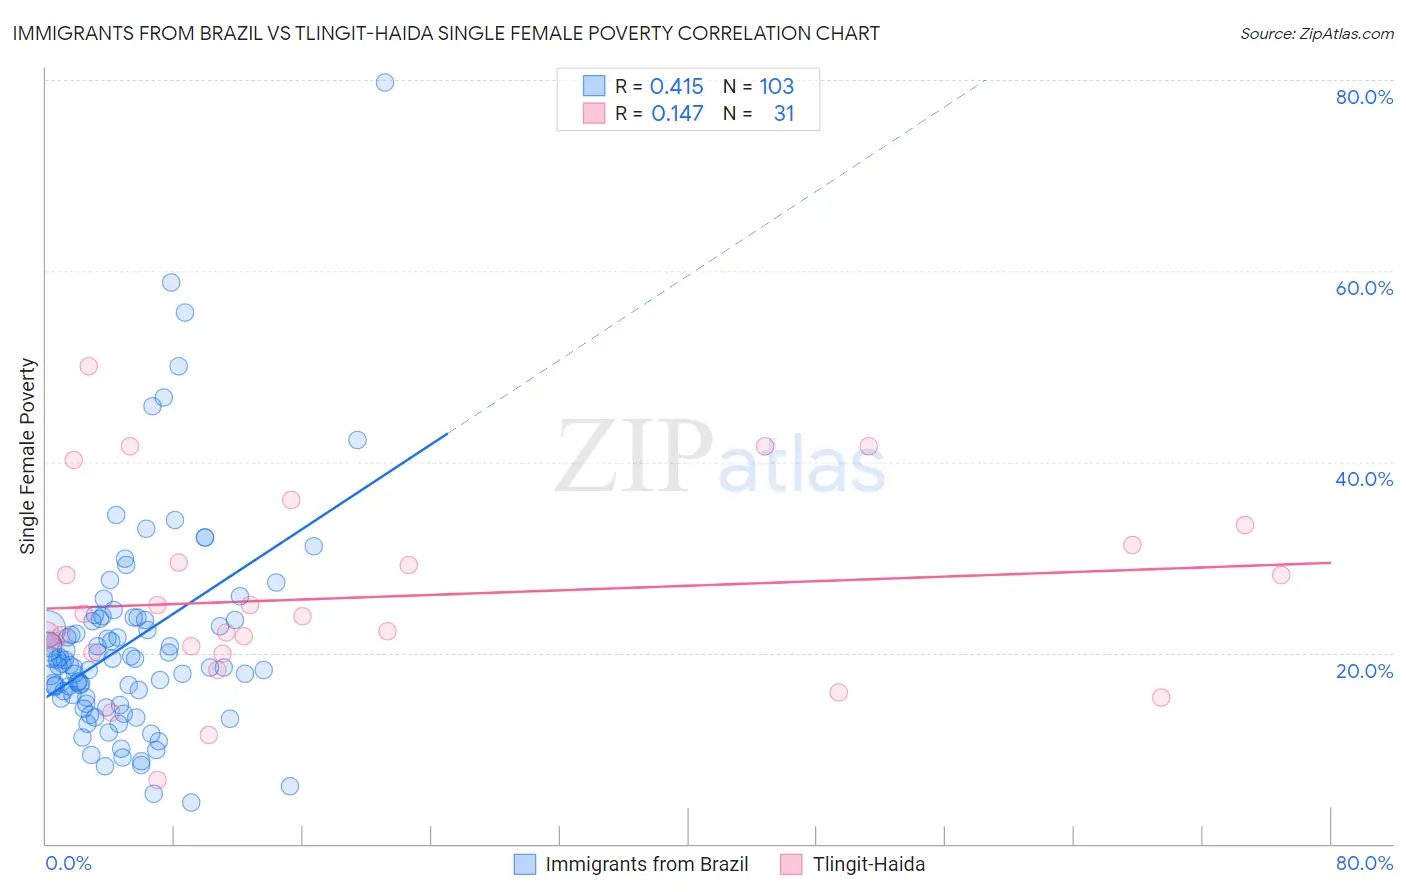
Immigrants from Brazil vs Tlingit-Haida Single Female Poverty Correlation Chart
The statistical analysis conducted on geographies consisting of 337,772,846 people shows a moderate positive correlation between the proportion of Immigrants from Brazil and poverty level among single females in the United States with a correlation coefficient (R) of 0.415 and weighted average of 19.7%. Similarly, the statistical analysis conducted on geographies consisting of 60,536,912 people shows a poor positive correlation between the proportion of Tlingit-Haida and poverty level among single females in the United States with a correlation coefficient (R) of 0.147 and weighted average of 21.9%, a difference of 11.4%.
Single Female Poverty Correlation Summary
| Measurement | Immigrants from Brazil | Tlingit-Haida |
| Minimum | 4.3% | 6.7% |
| Maximum | 79.7% | 50.0% |
| Range | 75.4% | 43.3% |
| Mean | 21.1% | 25.9% |
| Median | 18.8% | 23.9% |
| Interquartile 25% (IQ1) | 15.2% | 20.0% |
| Interquartile 75% (IQ3) | 23.4% | 31.2% |
| Interquartile Range (IQR) | 8.2% | 11.2% |
| Standard Deviation (Sample) | 11.3% | 9.9% |
| Standard Deviation (Population) | 11.2% | 9.8% |
Similar Demographics by Single Female Poverty
Demographics Similar to Immigrants from Brazil by Single Female Poverty
In terms of single female poverty, the demographic groups most similar to Immigrants from Brazil are Estonian (19.7%, a difference of 0.050%), Croatian (19.7%, a difference of 0.090%), Immigrants from France (19.7%, a difference of 0.21%), Sierra Leonean (19.7%, a difference of 0.23%), and Romanian (19.6%, a difference of 0.43%).
| Demographics | Rating | Rank | Single Female Poverty |
| Immigrants | Ukraine | 99.0 /100 | #89 | Exceptional 19.5% |
| Immigrants | Lebanon | 98.8 /100 | #90 | Exceptional 19.6% |
| Soviet Union | 98.8 /100 | #91 | Exceptional 19.6% |
| Italians | 98.8 /100 | #92 | Exceptional 19.6% |
| Immigrants | Austria | 98.8 /100 | #93 | Exceptional 19.6% |
| Romanians | 98.6 /100 | #94 | Exceptional 19.6% |
| Estonians | 98.2 /100 | #95 | Exceptional 19.7% |
| Immigrants | Brazil | 98.2 /100 | #96 | Exceptional 19.7% |
| Croatians | 98.1 /100 | #97 | Exceptional 19.7% |
| Immigrants | France | 97.9 /100 | #98 | Exceptional 19.7% |
| Sierra Leoneans | 97.9 /100 | #99 | Exceptional 19.7% |
| Ukrainians | 97.6 /100 | #100 | Exceptional 19.8% |
| Immigrants | Belgium | 97.3 /100 | #101 | Exceptional 19.8% |
| Immigrants | Cameroon | 97.3 /100 | #102 | Exceptional 19.8% |
| Immigrants | Southern Europe | 97.1 /100 | #103 | Exceptional 19.9% |
Demographics Similar to Tlingit-Haida by Single Female Poverty
In terms of single female poverty, the demographic groups most similar to Tlingit-Haida are Immigrants from Western Africa (22.0%, a difference of 0.020%), Salvadoran (21.9%, a difference of 0.030%), Welsh (22.0%, a difference of 0.11%), Immigrants from Ghana (21.9%, a difference of 0.12%), and Immigrants from Thailand (22.0%, a difference of 0.12%).
| Demographics | Rating | Rank | Single Female Poverty |
| Immigrants | Eritrea | 7.9 /100 | #222 | Tragic 21.8% |
| Scottish | 7.3 /100 | #223 | Tragic 21.8% |
| Barbadians | 7.2 /100 | #224 | Tragic 21.8% |
| English | 6.4 /100 | #225 | Tragic 21.9% |
| Immigrants | Portugal | 5.8 /100 | #226 | Tragic 21.9% |
| Immigrants | Ghana | 5.8 /100 | #227 | Tragic 21.9% |
| Salvadorans | 5.5 /100 | #228 | Tragic 21.9% |
| Tlingit-Haida | 5.4 /100 | #229 | Tragic 21.9% |
| Immigrants | Western Africa | 5.3 /100 | #230 | Tragic 22.0% |
| Welsh | 5.0 /100 | #231 | Tragic 22.0% |
| Immigrants | Thailand | 5.0 /100 | #232 | Tragic 22.0% |
| Spaniards | 4.7 /100 | #233 | Tragic 22.0% |
| Spanish | 4.7 /100 | #234 | Tragic 22.0% |
| Dutch | 4.6 /100 | #235 | Tragic 22.0% |
| Immigrants | Ecuador | 4.2 /100 | #236 | Tragic 22.0% |