Immigrants from Somalia vs Immigrants from Yemen Single Female Poverty
COMPARE
Immigrants from Somalia
Immigrants from Yemen
Single Female Poverty
Single Female Poverty Comparison
Immigrants from Somalia
Immigrants from Yemen
25.8%
SINGLE FEMALE POVERTY
0.0/ 100
METRIC RATING
316th/ 347
METRIC RANK
28.9%
SINGLE FEMALE POVERTY
0.0/ 100
METRIC RATING
335th/ 347
METRIC RANK
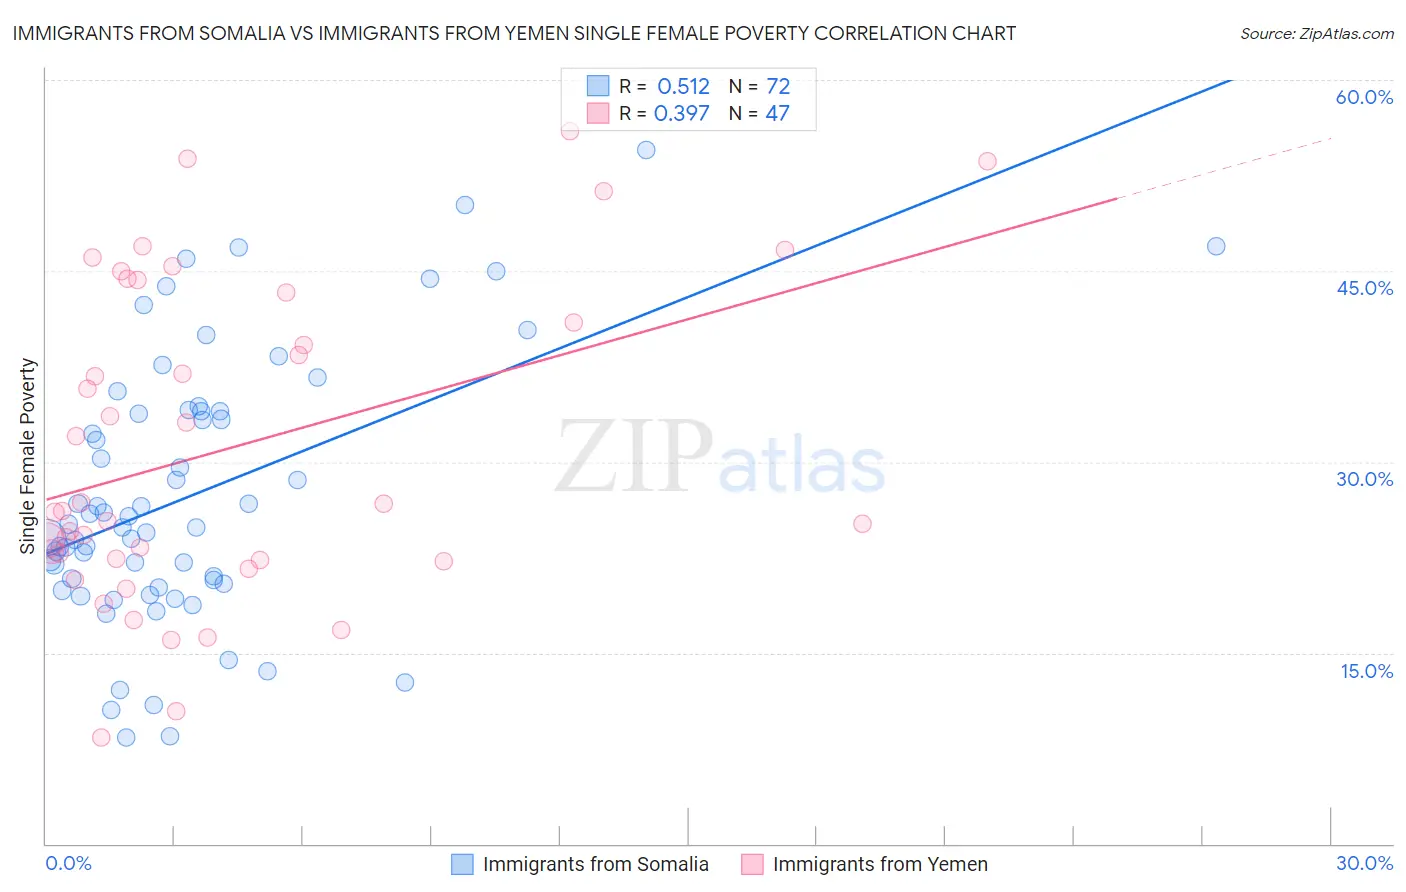
Immigrants from Somalia vs Immigrants from Yemen Single Female Poverty Correlation Chart
The statistical analysis conducted on geographies consisting of 91,892,482 people shows a substantial positive correlation between the proportion of Immigrants from Somalia and poverty level among single females in the United States with a correlation coefficient (R) of 0.512 and weighted average of 25.8%. Similarly, the statistical analysis conducted on geographies consisting of 82,238,204 people shows a mild positive correlation between the proportion of Immigrants from Yemen and poverty level among single females in the United States with a correlation coefficient (R) of 0.397 and weighted average of 28.9%, a difference of 12.2%.
Single Female Poverty Correlation Summary
| Measurement | Immigrants from Somalia | Immigrants from Yemen |
| Minimum | 8.3% | 8.3% |
| Maximum | 54.5% | 56.0% |
| Range | 46.2% | 47.7% |
| Mean | 27.4% | 31.0% |
| Median | 25.0% | 26.2% |
| Interquartile 25% (IQ1) | 20.6% | 22.3% |
| Interquartile 75% (IQ3) | 34.0% | 43.3% |
| Interquartile Range (IQR) | 13.4% | 20.9% |
| Standard Deviation (Sample) | 10.4% | 12.3% |
| Standard Deviation (Population) | 10.3% | 12.2% |
Demographics Similar to Immigrants from Somalia and Immigrants from Yemen by Single Female Poverty
In terms of single female poverty, the demographic groups most similar to Immigrants from Somalia are Iroquois (25.7%, a difference of 0.15%), Ottawa (26.0%, a difference of 0.84%), Chickasaw (26.3%, a difference of 1.9%), Black/African American (26.4%, a difference of 2.2%), and Arapaho (26.4%, a difference of 2.5%). Similarly, the demographic groups most similar to Immigrants from Yemen are Pueblo (28.6%, a difference of 1.1%), Ute (28.4%, a difference of 1.9%), Yakama (28.3%, a difference of 2.3%), Native/Alaskan (28.2%, a difference of 2.5%), and Hopi (28.0%, a difference of 3.2%).
| Demographics | Rating | Rank | Single Female Poverty |
| Iroquois | 0.0 /100 | #315 | Tragic 25.7% |
| Immigrants | Somalia | 0.0 /100 | #316 | Tragic 25.8% |
| Ottawa | 0.0 /100 | #317 | Tragic 26.0% |
| Chickasaw | 0.0 /100 | #318 | Tragic 26.3% |
| Blacks/African Americans | 0.0 /100 | #319 | Tragic 26.4% |
| Arapaho | 0.0 /100 | #320 | Tragic 26.4% |
| Yup'ik | 0.0 /100 | #321 | Tragic 26.6% |
| Seminole | 0.0 /100 | #322 | Tragic 26.8% |
| Chippewa | 0.0 /100 | #323 | Tragic 26.8% |
| Kiowa | 0.0 /100 | #324 | Tragic 26.9% |
| Choctaw | 0.0 /100 | #325 | Tragic 27.2% |
| Creek | 0.0 /100 | #326 | Tragic 27.4% |
| Dutch West Indians | 0.0 /100 | #327 | Tragic 27.5% |
| Apache | 0.0 /100 | #328 | Tragic 27.7% |
| Menominee | 0.0 /100 | #329 | Tragic 27.8% |
| Hopi | 0.0 /100 | #330 | Tragic 28.0% |
| Natives/Alaskans | 0.0 /100 | #331 | Tragic 28.2% |
| Yakama | 0.0 /100 | #332 | Tragic 28.3% |
| Ute | 0.0 /100 | #333 | Tragic 28.4% |
| Pueblo | 0.0 /100 | #334 | Tragic 28.6% |
| Immigrants | Yemen | 0.0 /100 | #335 | Tragic 28.9% |