Immigrants from Somalia vs Comanche Single Female Poverty
COMPARE
Immigrants from Somalia
Comanche
Single Female Poverty
Single Female Poverty Comparison
Immigrants from Somalia
Comanche
25.8%
SINGLE FEMALE POVERTY
0.0/ 100
METRIC RATING
316th/ 347
METRIC RANK
25.6%
SINGLE FEMALE POVERTY
0.0/ 100
METRIC RATING
313th/ 347
METRIC RANK
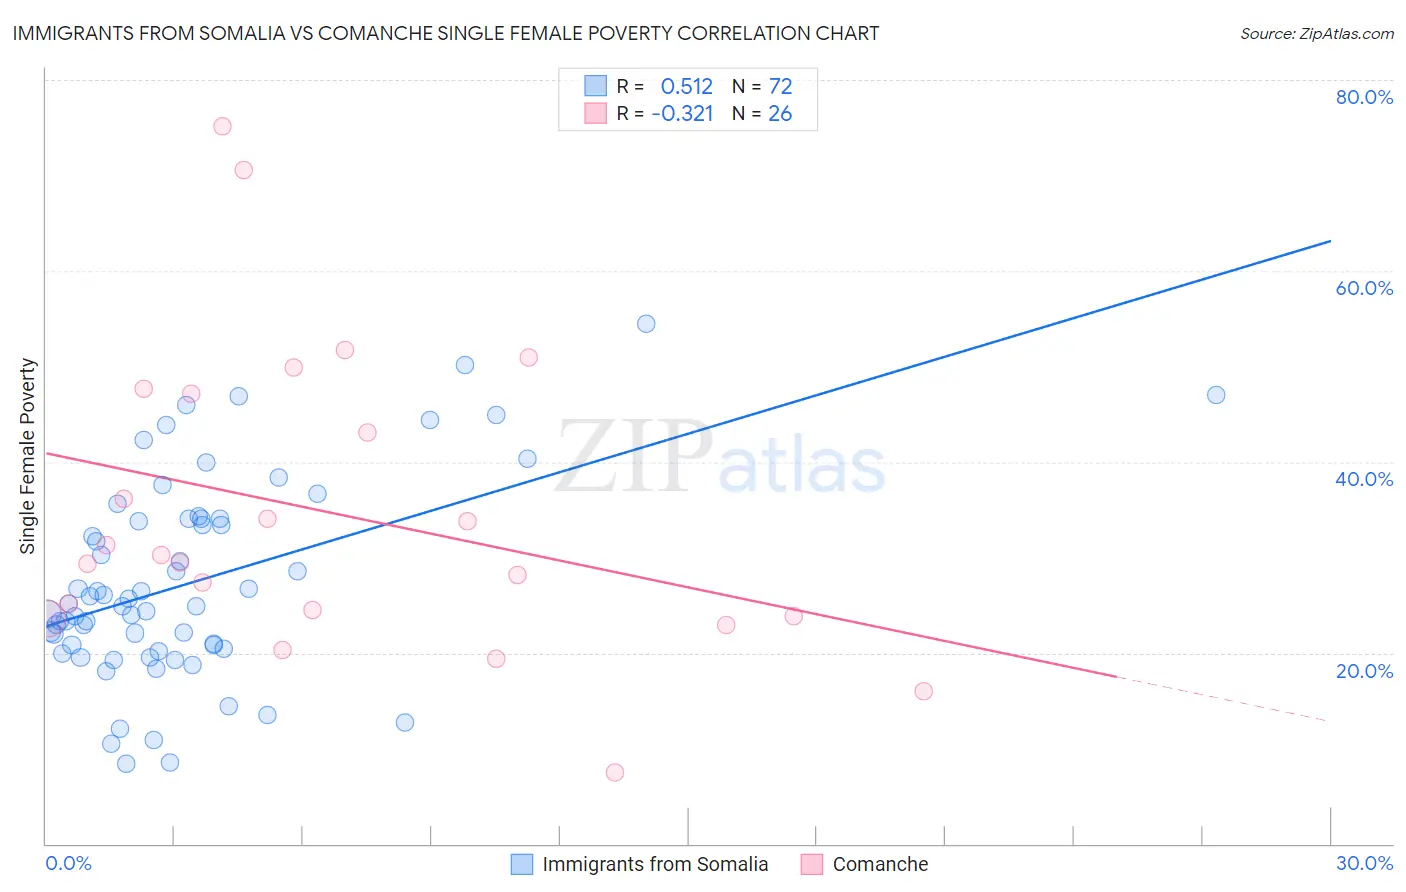
Immigrants from Somalia vs Comanche Single Female Poverty Correlation Chart
The statistical analysis conducted on geographies consisting of 91,892,482 people shows a substantial positive correlation between the proportion of Immigrants from Somalia and poverty level among single females in the United States with a correlation coefficient (R) of 0.512 and weighted average of 25.8%. Similarly, the statistical analysis conducted on geographies consisting of 109,354,794 people shows a mild negative correlation between the proportion of Comanche and poverty level among single females in the United States with a correlation coefficient (R) of -0.321 and weighted average of 25.6%, a difference of 0.83%.
Single Female Poverty Correlation Summary
| Measurement | Immigrants from Somalia | Comanche |
| Minimum | 8.3% | 7.4% |
| Maximum | 54.5% | 75.2% |
| Range | 46.2% | 67.8% |
| Mean | 27.4% | 34.6% |
| Median | 25.0% | 29.9% |
| Interquartile 25% (IQ1) | 20.6% | 23.8% |
| Interquartile 75% (IQ3) | 34.0% | 47.1% |
| Interquartile Range (IQR) | 13.4% | 23.3% |
| Standard Deviation (Sample) | 10.4% | 16.0% |
| Standard Deviation (Population) | 10.3% | 15.7% |
Demographics Similar to Immigrants from Somalia and Comanche by Single Female Poverty
In terms of single female poverty, the demographic groups most similar to Immigrants from Somalia are Iroquois (25.7%, a difference of 0.15%), Cherokee (25.7%, a difference of 0.47%), Ottawa (26.0%, a difference of 0.84%), Paiute (25.5%, a difference of 0.94%), and Immigrants from Honduras (25.5%, a difference of 0.99%). Similarly, the demographic groups most similar to Comanche are Paiute (25.5%, a difference of 0.11%), Immigrants from Honduras (25.5%, a difference of 0.16%), Cherokee (25.7%, a difference of 0.36%), Central American Indian (25.5%, a difference of 0.44%), and Dominican (25.4%, a difference of 0.59%).
| Demographics | Rating | Rank | Single Female Poverty |
| Immigrants | Congo | 0.0 /100 | #304 | Tragic 25.3% |
| Immigrants | Dominican Republic | 0.0 /100 | #305 | Tragic 25.3% |
| Immigrants | Mexico | 0.0 /100 | #306 | Tragic 25.3% |
| Potawatomi | 0.0 /100 | #307 | Tragic 25.4% |
| Aleuts | 0.0 /100 | #308 | Tragic 25.4% |
| Dominicans | 0.0 /100 | #309 | Tragic 25.4% |
| Central American Indians | 0.0 /100 | #310 | Tragic 25.5% |
| Immigrants | Honduras | 0.0 /100 | #311 | Tragic 25.5% |
| Paiute | 0.0 /100 | #312 | Tragic 25.5% |
| Comanche | 0.0 /100 | #313 | Tragic 25.6% |
| Cherokee | 0.0 /100 | #314 | Tragic 25.7% |
| Iroquois | 0.0 /100 | #315 | Tragic 25.7% |
| Immigrants | Somalia | 0.0 /100 | #316 | Tragic 25.8% |
| Ottawa | 0.0 /100 | #317 | Tragic 26.0% |
| Chickasaw | 0.0 /100 | #318 | Tragic 26.3% |
| Blacks/African Americans | 0.0 /100 | #319 | Tragic 26.4% |
| Arapaho | 0.0 /100 | #320 | Tragic 26.4% |
| Yup'ik | 0.0 /100 | #321 | Tragic 26.6% |
| Seminole | 0.0 /100 | #322 | Tragic 26.8% |
| Chippewa | 0.0 /100 | #323 | Tragic 26.8% |
| Kiowa | 0.0 /100 | #324 | Tragic 26.9% |