Chinese vs Comanche Single Female Poverty
COMPARE
Chinese
Comanche
Single Female Poverty
Single Female Poverty Comparison
Chinese
Comanche
16.1%
SINGLE FEMALE POVERTY
100.0/ 100
METRIC RATING
1st/ 347
METRIC RANK
25.6%
SINGLE FEMALE POVERTY
0.0/ 100
METRIC RATING
313th/ 347
METRIC RANK
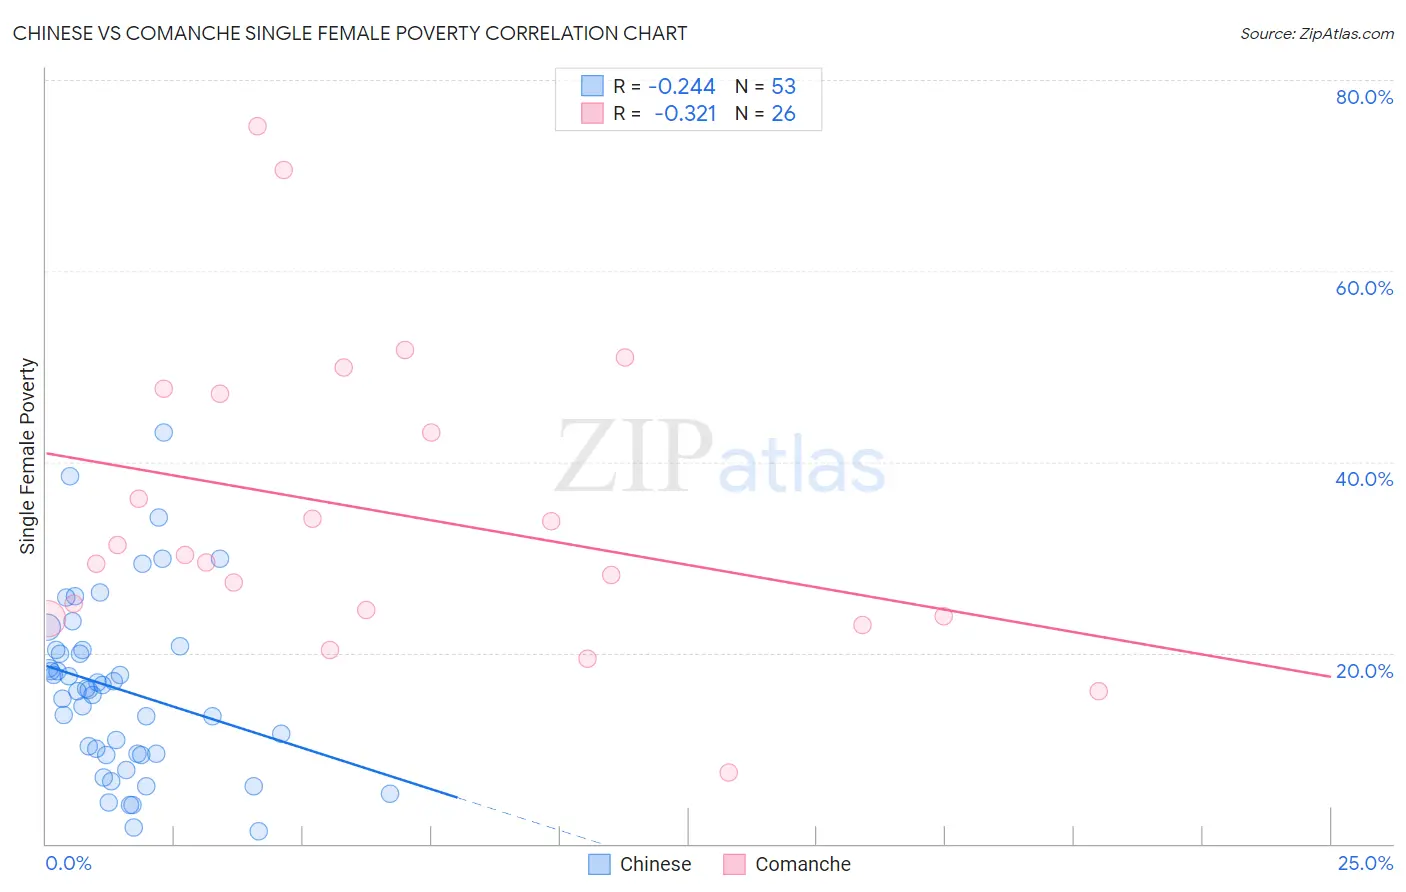
Chinese vs Comanche Single Female Poverty Correlation Chart
The statistical analysis conducted on geographies consisting of 64,651,041 people shows a weak negative correlation between the proportion of Chinese and poverty level among single females in the United States with a correlation coefficient (R) of -0.244 and weighted average of 16.1%. Similarly, the statistical analysis conducted on geographies consisting of 109,354,794 people shows a mild negative correlation between the proportion of Comanche and poverty level among single females in the United States with a correlation coefficient (R) of -0.321 and weighted average of 25.6%, a difference of 58.4%.
Single Female Poverty Correlation Summary
| Measurement | Chinese | Comanche |
| Minimum | 1.3% | 7.4% |
| Maximum | 43.0% | 75.2% |
| Range | 41.7% | 67.8% |
| Mean | 16.1% | 34.6% |
| Median | 16.1% | 29.9% |
| Interquartile 25% (IQ1) | 9.3% | 23.8% |
| Interquartile 75% (IQ3) | 20.3% | 47.1% |
| Interquartile Range (IQR) | 10.9% | 23.3% |
| Standard Deviation (Sample) | 9.1% | 16.0% |
| Standard Deviation (Population) | 9.1% | 15.7% |
Similar Demographics by Single Female Poverty
Demographics Similar to Chinese by Single Female Poverty
In terms of single female poverty, the demographic groups most similar to Chinese are Immigrants from Taiwan (16.4%, a difference of 1.3%), Immigrants from Hong Kong (16.5%, a difference of 2.4%), Immigrants from India (16.8%, a difference of 4.2%), Assyrian/Chaldean/Syriac (17.0%, a difference of 5.0%), and Filipino (17.0%, a difference of 5.2%).
| Demographics | Rating | Rank | Single Female Poverty |
| Chinese | 100.0 /100 | #1 | Exceptional 16.1% |
| Immigrants | Taiwan | 100.0 /100 | #2 | Exceptional 16.4% |
| Immigrants | Hong Kong | 100.0 /100 | #3 | Exceptional 16.5% |
| Immigrants | India | 100.0 /100 | #4 | Exceptional 16.8% |
| Assyrians/Chaldeans/Syriacs | 100.0 /100 | #5 | Exceptional 17.0% |
| Filipinos | 100.0 /100 | #6 | Exceptional 17.0% |
| Thais | 100.0 /100 | #7 | Exceptional 17.3% |
| Immigrants | Iran | 100.0 /100 | #8 | Exceptional 17.5% |
| Bhutanese | 100.0 /100 | #9 | Exceptional 17.7% |
| Immigrants | Ireland | 100.0 /100 | #10 | Exceptional 17.8% |
| Immigrants | Lithuania | 100.0 /100 | #11 | Exceptional 17.8% |
| Immigrants | South Central Asia | 100.0 /100 | #12 | Exceptional 17.8% |
| Immigrants | Bolivia | 100.0 /100 | #13 | Exceptional 17.8% |
| Bolivians | 100.0 /100 | #14 | Exceptional 17.9% |
| Indians (Asian) | 100.0 /100 | #15 | Exceptional 17.9% |
Demographics Similar to Comanche by Single Female Poverty
In terms of single female poverty, the demographic groups most similar to Comanche are Paiute (25.5%, a difference of 0.11%), Immigrants from Honduras (25.5%, a difference of 0.16%), Cherokee (25.7%, a difference of 0.36%), Central American Indian (25.5%, a difference of 0.44%), and Dominican (25.4%, a difference of 0.59%).
| Demographics | Rating | Rank | Single Female Poverty |
| Immigrants | Mexico | 0.0 /100 | #306 | Tragic 25.3% |
| Potawatomi | 0.0 /100 | #307 | Tragic 25.4% |
| Aleuts | 0.0 /100 | #308 | Tragic 25.4% |
| Dominicans | 0.0 /100 | #309 | Tragic 25.4% |
| Central American Indians | 0.0 /100 | #310 | Tragic 25.5% |
| Immigrants | Honduras | 0.0 /100 | #311 | Tragic 25.5% |
| Paiute | 0.0 /100 | #312 | Tragic 25.5% |
| Comanche | 0.0 /100 | #313 | Tragic 25.6% |
| Cherokee | 0.0 /100 | #314 | Tragic 25.7% |
| Iroquois | 0.0 /100 | #315 | Tragic 25.7% |
| Immigrants | Somalia | 0.0 /100 | #316 | Tragic 25.8% |
| Ottawa | 0.0 /100 | #317 | Tragic 26.0% |
| Chickasaw | 0.0 /100 | #318 | Tragic 26.3% |
| Blacks/African Americans | 0.0 /100 | #319 | Tragic 26.4% |
| Arapaho | 0.0 /100 | #320 | Tragic 26.4% |