Immigrants from Saudi Arabia vs Immigrants from Jamaica Poverty
COMPARE
Immigrants from Saudi Arabia
Immigrants from Jamaica
Poverty
Poverty Comparison
Immigrants from Saudi Arabia
Immigrants from Jamaica
13.8%
POVERTY
0.8/ 100
METRIC RATING
233rd/ 347
METRIC RANK
14.4%
POVERTY
0.1/ 100
METRIC RATING
264th/ 347
METRIC RANK
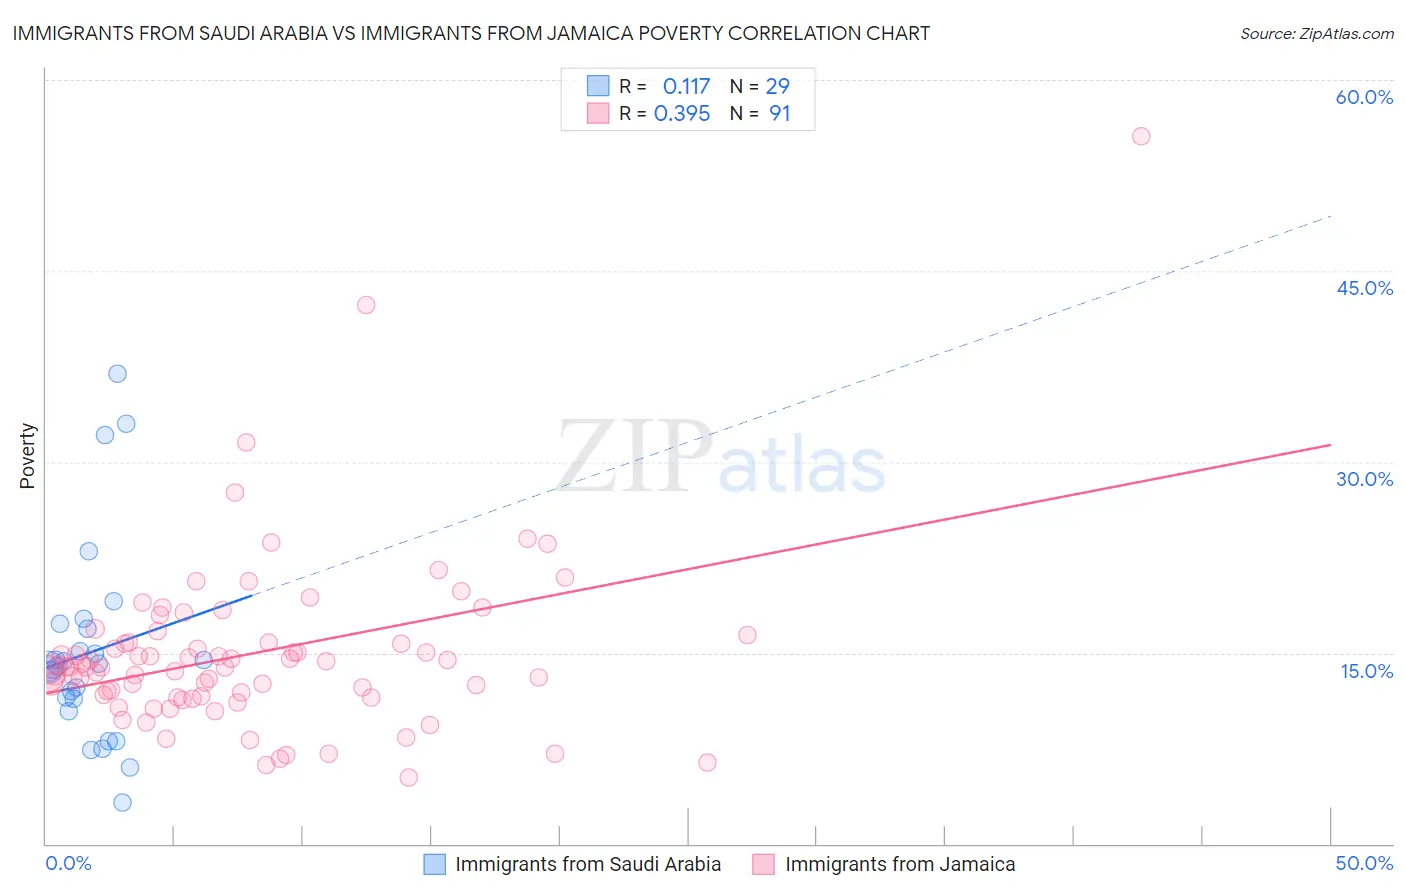
Immigrants from Saudi Arabia vs Immigrants from Jamaica Poverty Correlation Chart
The statistical analysis conducted on geographies consisting of 164,230,350 people shows a poor positive correlation between the proportion of Immigrants from Saudi Arabia and poverty level in the United States with a correlation coefficient (R) of 0.117 and weighted average of 13.8%. Similarly, the statistical analysis conducted on geographies consisting of 301,608,738 people shows a mild positive correlation between the proportion of Immigrants from Jamaica and poverty level in the United States with a correlation coefficient (R) of 0.395 and weighted average of 14.4%, a difference of 4.9%.
Poverty Correlation Summary
| Measurement | Immigrants from Saudi Arabia | Immigrants from Jamaica |
| Minimum | 3.3% | 5.2% |
| Maximum | 37.0% | 55.6% |
| Range | 33.7% | 50.4% |
| Mean | 15.0% | 14.9% |
| Median | 14.0% | 13.9% |
| Interquartile 25% (IQ1) | 10.9% | 11.6% |
| Interquartile 75% (IQ3) | 17.1% | 15.8% |
| Interquartile Range (IQR) | 6.2% | 4.3% |
| Standard Deviation (Sample) | 7.8% | 6.9% |
| Standard Deviation (Population) | 7.6% | 6.9% |
Similar Demographics by Poverty
Demographics Similar to Immigrants from Saudi Arabia by Poverty
In terms of poverty, the demographic groups most similar to Immigrants from Saudi Arabia are Immigrants from Laos (13.8%, a difference of 0.24%), Fijian (13.7%, a difference of 0.25%), Cuban (13.9%, a difference of 0.68%), Immigrants from Armenia (13.9%, a difference of 0.71%), and French American Indian (13.9%, a difference of 0.73%).
| Demographics | Rating | Rank | Poverty |
| Marshallese | 2.2 /100 | #226 | Tragic 13.4% |
| Alaska Natives | 2.1 /100 | #227 | Tragic 13.5% |
| Immigrants | Nigeria | 1.7 /100 | #228 | Tragic 13.5% |
| Osage | 1.5 /100 | #229 | Tragic 13.6% |
| Alaskan Athabascans | 1.5 /100 | #230 | Tragic 13.6% |
| Nigerians | 1.4 /100 | #231 | Tragic 13.6% |
| Fijians | 0.8 /100 | #232 | Tragic 13.7% |
| Immigrants | Saudi Arabia | 0.8 /100 | #233 | Tragic 13.8% |
| Immigrants | Laos | 0.7 /100 | #234 | Tragic 13.8% |
| Cubans | 0.6 /100 | #235 | Tragic 13.9% |
| Immigrants | Armenia | 0.5 /100 | #236 | Tragic 13.9% |
| French American Indians | 0.5 /100 | #237 | Tragic 13.9% |
| Ghanaians | 0.5 /100 | #238 | Tragic 13.9% |
| Nicaraguans | 0.4 /100 | #239 | Tragic 13.9% |
| Immigrants | Middle Africa | 0.4 /100 | #240 | Tragic 14.0% |
Demographics Similar to Immigrants from Jamaica by Poverty
In terms of poverty, the demographic groups most similar to Immigrants from Jamaica are Jamaican (14.4%, a difference of 0.090%), Immigrants from Guyana (14.5%, a difference of 0.13%), Guyanese (14.5%, a difference of 0.30%), Immigrants from Liberia (14.4%, a difference of 0.43%), and Cherokee (14.4%, a difference of 0.60%).
| Demographics | Rating | Rank | Poverty |
| Trinidadians and Tobagonians | 0.1 /100 | #257 | Tragic 14.3% |
| Ottawa | 0.1 /100 | #258 | Tragic 14.3% |
| Immigrants | Nicaragua | 0.1 /100 | #259 | Tragic 14.3% |
| Cape Verdeans | 0.1 /100 | #260 | Tragic 14.4% |
| Cherokee | 0.1 /100 | #261 | Tragic 14.4% |
| Immigrants | Liberia | 0.1 /100 | #262 | Tragic 14.4% |
| Jamaicans | 0.1 /100 | #263 | Tragic 14.4% |
| Immigrants | Jamaica | 0.1 /100 | #264 | Tragic 14.4% |
| Immigrants | Guyana | 0.1 /100 | #265 | Tragic 14.5% |
| Guyanese | 0.1 /100 | #266 | Tragic 14.5% |
| Iroquois | 0.1 /100 | #267 | Tragic 14.5% |
| Sub-Saharan Africans | 0.1 /100 | #268 | Tragic 14.5% |
| Immigrants | Cuba | 0.1 /100 | #269 | Tragic 14.6% |
| Central Americans | 0.1 /100 | #270 | Tragic 14.6% |
| Shoshone | 0.0 /100 | #271 | Tragic 14.7% |