Immigrants from Saudi Arabia vs Spanish American Indian Poverty
COMPARE
Immigrants from Saudi Arabia
Spanish American Indian
Poverty
Poverty Comparison
Immigrants from Saudi Arabia
Spanish American Indians
13.8%
POVERTY
0.8/ 100
METRIC RATING
233rd/ 347
METRIC RANK
14.2%
POVERTY
0.2/ 100
METRIC RATING
252nd/ 347
METRIC RANK
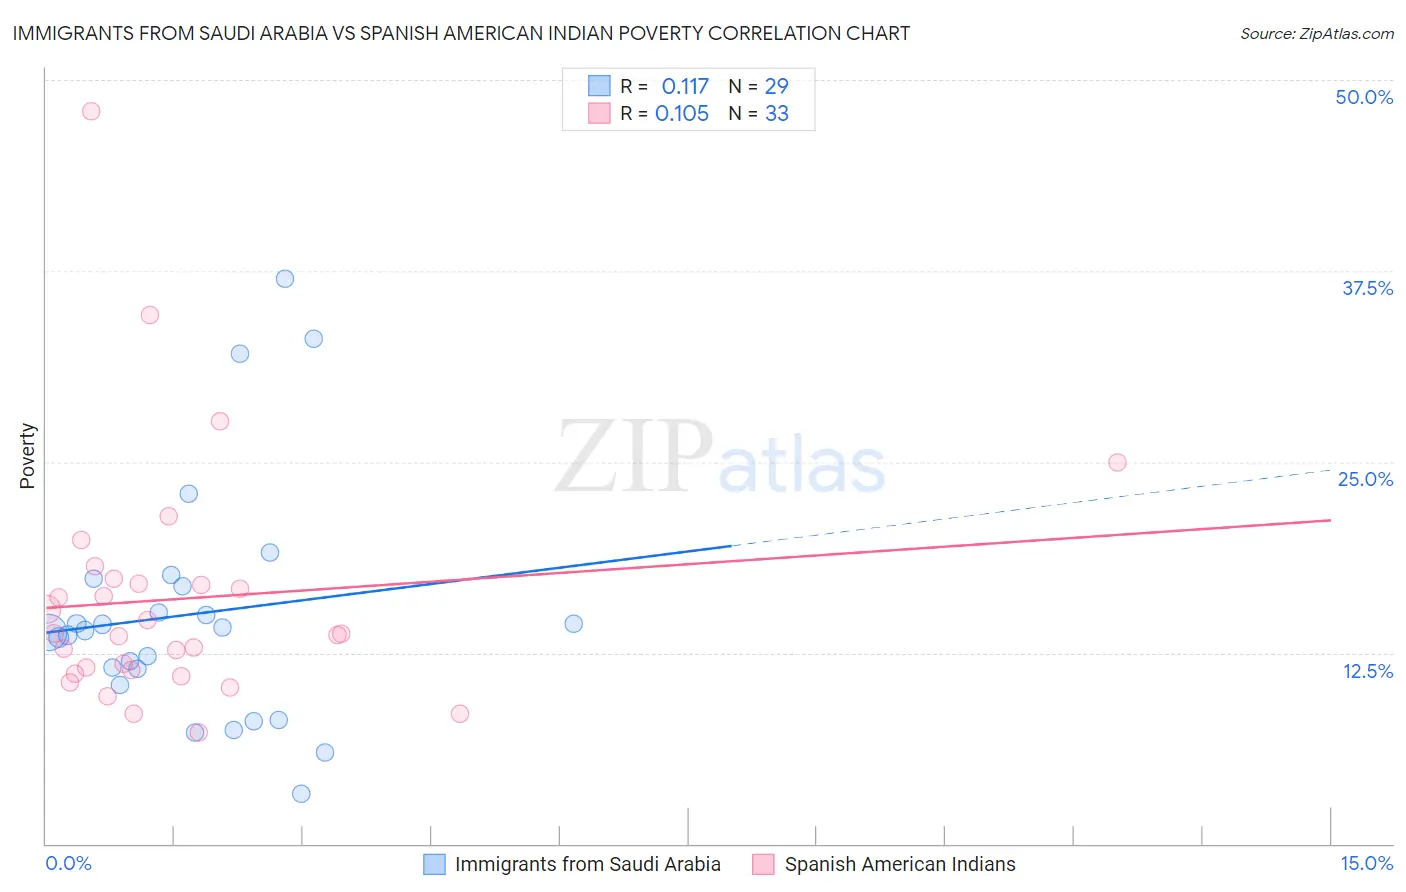
Immigrants from Saudi Arabia vs Spanish American Indian Poverty Correlation Chart
The statistical analysis conducted on geographies consisting of 164,230,350 people shows a poor positive correlation between the proportion of Immigrants from Saudi Arabia and poverty level in the United States with a correlation coefficient (R) of 0.117 and weighted average of 13.8%. Similarly, the statistical analysis conducted on geographies consisting of 73,142,105 people shows a poor positive correlation between the proportion of Spanish American Indians and poverty level in the United States with a correlation coefficient (R) of 0.105 and weighted average of 14.2%, a difference of 3.3%.
Poverty Correlation Summary
| Measurement | Immigrants from Saudi Arabia | Spanish American Indian |
| Minimum | 3.3% | 7.3% |
| Maximum | 37.0% | 48.0% |
| Range | 33.7% | 40.7% |
| Mean | 15.0% | 16.0% |
| Median | 14.0% | 13.8% |
| Interquartile 25% (IQ1) | 10.9% | 11.3% |
| Interquartile 75% (IQ3) | 17.1% | 17.2% |
| Interquartile Range (IQR) | 6.2% | 5.9% |
| Standard Deviation (Sample) | 7.8% | 8.1% |
| Standard Deviation (Population) | 7.6% | 8.0% |
Demographics Similar to Immigrants from Saudi Arabia and Spanish American Indians by Poverty
In terms of poverty, the demographic groups most similar to Immigrants from Saudi Arabia are Immigrants from Laos (13.8%, a difference of 0.24%), Fijian (13.7%, a difference of 0.25%), Cuban (13.9%, a difference of 0.68%), Immigrants from Armenia (13.9%, a difference of 0.71%), and French American Indian (13.9%, a difference of 0.73%). Similarly, the demographic groups most similar to Spanish American Indians are Immigrants from Burma/Myanmar (14.2%, a difference of 0.11%), Cree (14.2%, a difference of 0.20%), Immigrants from Ghana (14.2%, a difference of 0.50%), Immigrants from Western Africa (14.1%, a difference of 0.60%), and Liberian (14.1%, a difference of 0.61%).
| Demographics | Rating | Rank | Poverty |
| Fijians | 0.8 /100 | #232 | Tragic 13.7% |
| Immigrants | Saudi Arabia | 0.8 /100 | #233 | Tragic 13.8% |
| Immigrants | Laos | 0.7 /100 | #234 | Tragic 13.8% |
| Cubans | 0.6 /100 | #235 | Tragic 13.9% |
| Immigrants | Armenia | 0.5 /100 | #236 | Tragic 13.9% |
| French American Indians | 0.5 /100 | #237 | Tragic 13.9% |
| Ghanaians | 0.5 /100 | #238 | Tragic 13.9% |
| Nicaraguans | 0.4 /100 | #239 | Tragic 13.9% |
| Immigrants | Middle Africa | 0.4 /100 | #240 | Tragic 14.0% |
| Salvadorans | 0.4 /100 | #241 | Tragic 14.0% |
| Ecuadorians | 0.4 /100 | #242 | Tragic 14.0% |
| Sudanese | 0.3 /100 | #243 | Tragic 14.0% |
| Nepalese | 0.3 /100 | #244 | Tragic 14.0% |
| Immigrants | Sudan | 0.3 /100 | #245 | Tragic 14.1% |
| Potawatomi | 0.3 /100 | #246 | Tragic 14.1% |
| Liberians | 0.2 /100 | #247 | Tragic 14.1% |
| Immigrants | Western Africa | 0.2 /100 | #248 | Tragic 14.1% |
| Immigrants | Ghana | 0.2 /100 | #249 | Tragic 14.2% |
| Cree | 0.2 /100 | #250 | Tragic 14.2% |
| Immigrants | Burma/Myanmar | 0.2 /100 | #251 | Tragic 14.2% |
| Spanish American Indians | 0.2 /100 | #252 | Tragic 14.2% |