Immigrants from Saudi Arabia vs Immigrants from Kazakhstan Poverty
COMPARE
Immigrants from Saudi Arabia
Immigrants from Kazakhstan
Poverty
Poverty Comparison
Immigrants from Saudi Arabia
Immigrants from Kazakhstan
13.8%
POVERTY
0.8/ 100
METRIC RATING
233rd/ 347
METRIC RANK
12.0%
POVERTY
72.3/ 100
METRIC RATING
150th/ 347
METRIC RANK
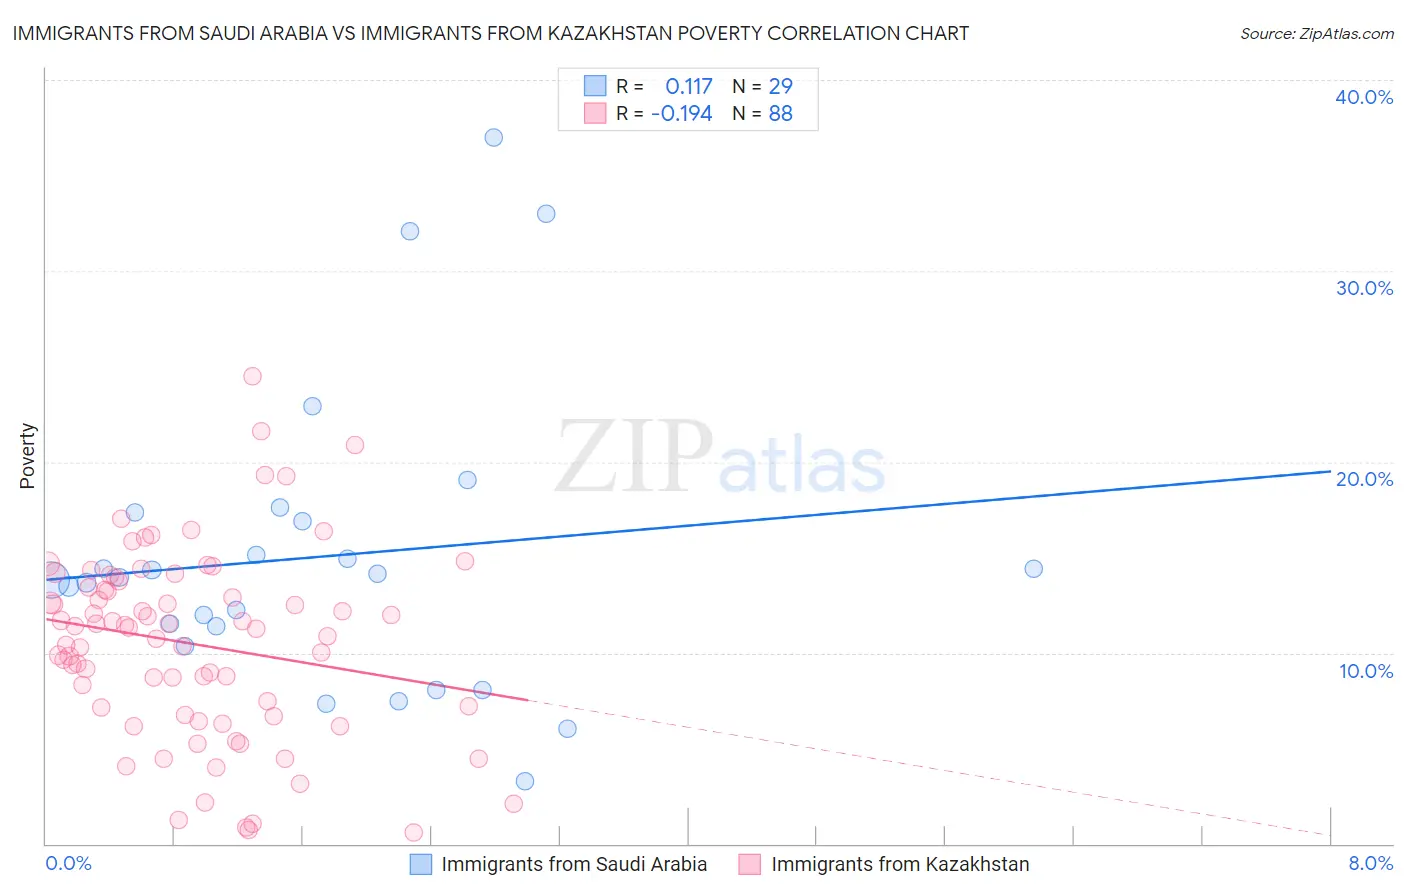
Immigrants from Saudi Arabia vs Immigrants from Kazakhstan Poverty Correlation Chart
The statistical analysis conducted on geographies consisting of 164,230,350 people shows a poor positive correlation between the proportion of Immigrants from Saudi Arabia and poverty level in the United States with a correlation coefficient (R) of 0.117 and weighted average of 13.8%. Similarly, the statistical analysis conducted on geographies consisting of 124,425,744 people shows a poor negative correlation between the proportion of Immigrants from Kazakhstan and poverty level in the United States with a correlation coefficient (R) of -0.194 and weighted average of 12.0%, a difference of 14.5%.
Poverty Correlation Summary
| Measurement | Immigrants from Saudi Arabia | Immigrants from Kazakhstan |
| Minimum | 3.3% | 0.57% |
| Maximum | 37.0% | 24.5% |
| Range | 33.7% | 23.9% |
| Mean | 15.0% | 10.5% |
| Median | 14.0% | 11.3% |
| Interquartile 25% (IQ1) | 10.9% | 6.9% |
| Interquartile 75% (IQ3) | 17.1% | 13.6% |
| Interquartile Range (IQR) | 6.2% | 6.6% |
| Standard Deviation (Sample) | 7.8% | 4.9% |
| Standard Deviation (Population) | 7.6% | 4.9% |
Similar Demographics by Poverty
Demographics Similar to Immigrants from Saudi Arabia by Poverty
In terms of poverty, the demographic groups most similar to Immigrants from Saudi Arabia are Immigrants from Laos (13.8%, a difference of 0.24%), Fijian (13.7%, a difference of 0.25%), Cuban (13.9%, a difference of 0.68%), Immigrants from Armenia (13.9%, a difference of 0.71%), and French American Indian (13.9%, a difference of 0.73%).
| Demographics | Rating | Rank | Poverty |
| Marshallese | 2.2 /100 | #226 | Tragic 13.4% |
| Alaska Natives | 2.1 /100 | #227 | Tragic 13.5% |
| Immigrants | Nigeria | 1.7 /100 | #228 | Tragic 13.5% |
| Osage | 1.5 /100 | #229 | Tragic 13.6% |
| Alaskan Athabascans | 1.5 /100 | #230 | Tragic 13.6% |
| Nigerians | 1.4 /100 | #231 | Tragic 13.6% |
| Fijians | 0.8 /100 | #232 | Tragic 13.7% |
| Immigrants | Saudi Arabia | 0.8 /100 | #233 | Tragic 13.8% |
| Immigrants | Laos | 0.7 /100 | #234 | Tragic 13.8% |
| Cubans | 0.6 /100 | #235 | Tragic 13.9% |
| Immigrants | Armenia | 0.5 /100 | #236 | Tragic 13.9% |
| French American Indians | 0.5 /100 | #237 | Tragic 13.9% |
| Ghanaians | 0.5 /100 | #238 | Tragic 13.9% |
| Nicaraguans | 0.4 /100 | #239 | Tragic 13.9% |
| Immigrants | Middle Africa | 0.4 /100 | #240 | Tragic 14.0% |
Demographics Similar to Immigrants from Kazakhstan by Poverty
In terms of poverty, the demographic groups most similar to Immigrants from Kazakhstan are Samoan (12.0%, a difference of 0.040%), Immigrants from Germany (12.0%, a difference of 0.050%), Immigrants from Malaysia (12.0%, a difference of 0.050%), Immigrants from Bosnia and Herzegovina (12.0%, a difference of 0.17%), and Afghan (12.0%, a difference of 0.33%).
| Demographics | Rating | Rank | Poverty |
| Brazilians | 79.7 /100 | #143 | Good 11.9% |
| Icelanders | 77.9 /100 | #144 | Good 11.9% |
| Syrians | 75.1 /100 | #145 | Good 12.0% |
| Afghans | 74.9 /100 | #146 | Good 12.0% |
| Immigrants | Bosnia and Herzegovina | 73.7 /100 | #147 | Good 12.0% |
| Immigrants | Germany | 72.7 /100 | #148 | Good 12.0% |
| Immigrants | Malaysia | 72.7 /100 | #149 | Good 12.0% |
| Immigrants | Kazakhstan | 72.3 /100 | #150 | Good 12.0% |
| Samoans | 71.9 /100 | #151 | Good 12.0% |
| Armenians | 67.6 /100 | #152 | Good 12.1% |
| Immigrants | Northern Africa | 63.9 /100 | #153 | Good 12.1% |
| Guamanians/Chamorros | 63.9 /100 | #154 | Good 12.1% |
| Hungarians | 63.6 /100 | #155 | Good 12.2% |
| Scotch-Irish | 62.6 /100 | #156 | Good 12.2% |
| Costa Ricans | 62.2 /100 | #157 | Good 12.2% |