Immigrants from Saudi Arabia vs Luxembourger Poverty
COMPARE
Immigrants from Saudi Arabia
Luxembourger
Poverty
Poverty Comparison
Immigrants from Saudi Arabia
Luxembourgers
13.8%
POVERTY
0.8/ 100
METRIC RATING
233rd/ 347
METRIC RANK
10.6%
POVERTY
99.7/ 100
METRIC RATING
21st/ 347
METRIC RANK
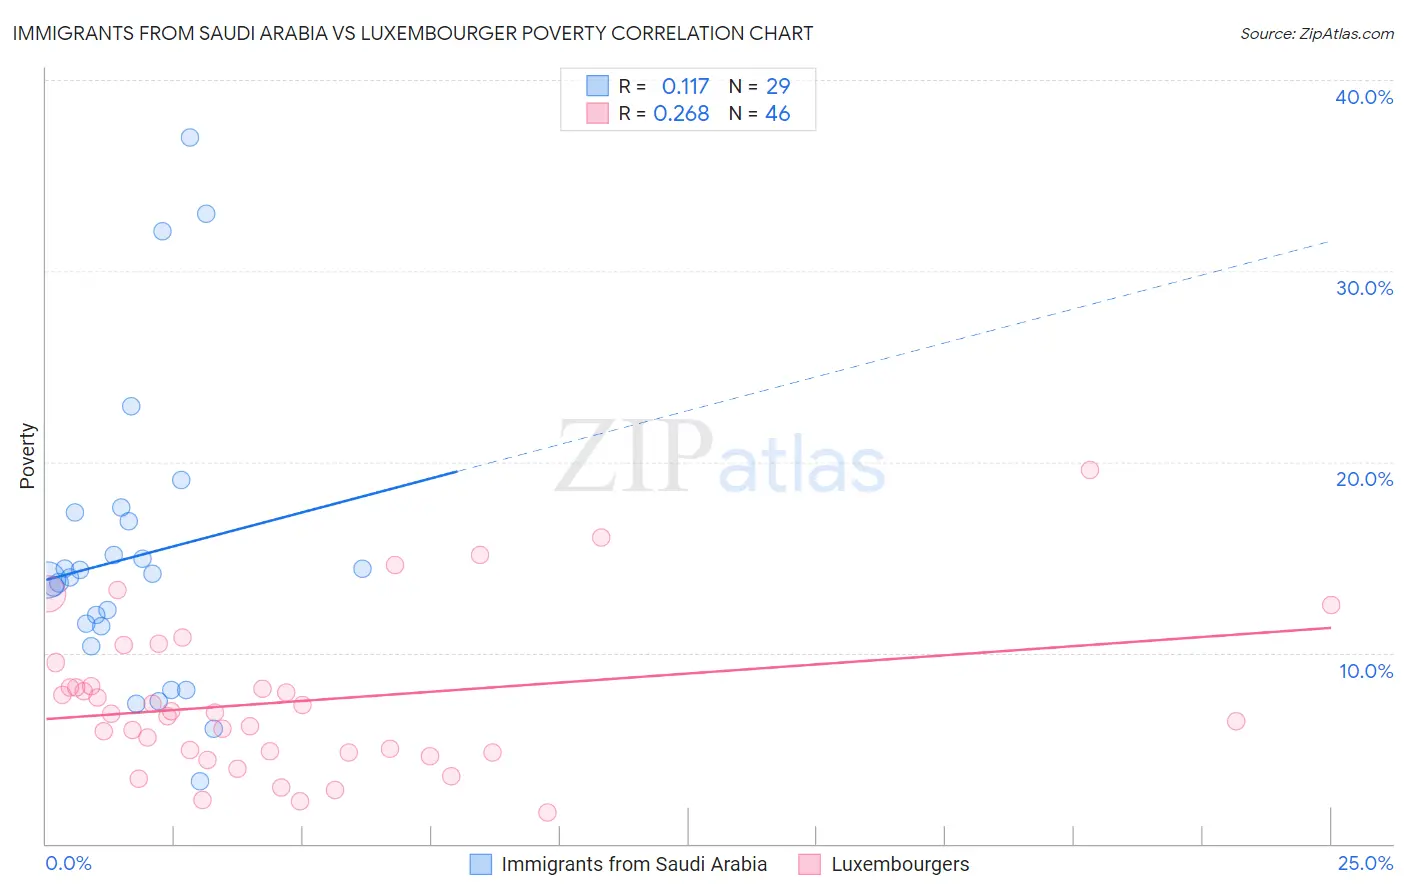
Immigrants from Saudi Arabia vs Luxembourger Poverty Correlation Chart
The statistical analysis conducted on geographies consisting of 164,230,350 people shows a poor positive correlation between the proportion of Immigrants from Saudi Arabia and poverty level in the United States with a correlation coefficient (R) of 0.117 and weighted average of 13.8%. Similarly, the statistical analysis conducted on geographies consisting of 144,648,044 people shows a weak positive correlation between the proportion of Luxembourgers and poverty level in the United States with a correlation coefficient (R) of 0.268 and weighted average of 10.6%, a difference of 30.2%.
Poverty Correlation Summary
| Measurement | Immigrants from Saudi Arabia | Luxembourger |
| Minimum | 3.3% | 1.6% |
| Maximum | 37.0% | 19.5% |
| Range | 33.7% | 17.9% |
| Mean | 15.0% | 7.5% |
| Median | 14.0% | 6.8% |
| Interquartile 25% (IQ1) | 10.9% | 4.8% |
| Interquartile 75% (IQ3) | 17.1% | 8.3% |
| Interquartile Range (IQR) | 6.2% | 3.5% |
| Standard Deviation (Sample) | 7.8% | 3.9% |
| Standard Deviation (Population) | 7.6% | 3.9% |
Similar Demographics by Poverty
Demographics Similar to Immigrants from Saudi Arabia by Poverty
In terms of poverty, the demographic groups most similar to Immigrants from Saudi Arabia are Immigrants from Laos (13.8%, a difference of 0.24%), Fijian (13.7%, a difference of 0.25%), Cuban (13.9%, a difference of 0.68%), Immigrants from Armenia (13.9%, a difference of 0.71%), and French American Indian (13.9%, a difference of 0.73%).
| Demographics | Rating | Rank | Poverty |
| Marshallese | 2.2 /100 | #226 | Tragic 13.4% |
| Alaska Natives | 2.1 /100 | #227 | Tragic 13.5% |
| Immigrants | Nigeria | 1.7 /100 | #228 | Tragic 13.5% |
| Osage | 1.5 /100 | #229 | Tragic 13.6% |
| Alaskan Athabascans | 1.5 /100 | #230 | Tragic 13.6% |
| Nigerians | 1.4 /100 | #231 | Tragic 13.6% |
| Fijians | 0.8 /100 | #232 | Tragic 13.7% |
| Immigrants | Saudi Arabia | 0.8 /100 | #233 | Tragic 13.8% |
| Immigrants | Laos | 0.7 /100 | #234 | Tragic 13.8% |
| Cubans | 0.6 /100 | #235 | Tragic 13.9% |
| Immigrants | Armenia | 0.5 /100 | #236 | Tragic 13.9% |
| French American Indians | 0.5 /100 | #237 | Tragic 13.9% |
| Ghanaians | 0.5 /100 | #238 | Tragic 13.9% |
| Nicaraguans | 0.4 /100 | #239 | Tragic 13.9% |
| Immigrants | Middle Africa | 0.4 /100 | #240 | Tragic 14.0% |
Demographics Similar to Luxembourgers by Poverty
In terms of poverty, the demographic groups most similar to Luxembourgers are Immigrants from North Macedonia (10.6%, a difference of 0.080%), Eastern European (10.6%, a difference of 0.16%), Immigrants from Scotland (10.6%, a difference of 0.19%), Swedish (10.6%, a difference of 0.27%), and Italian (10.6%, a difference of 0.31%).
| Demographics | Rating | Rank | Poverty |
| Immigrants | Bolivia | 99.8 /100 | #14 | Exceptional 10.4% |
| Bolivians | 99.8 /100 | #15 | Exceptional 10.4% |
| Lithuanians | 99.8 /100 | #16 | Exceptional 10.5% |
| Norwegians | 99.8 /100 | #17 | Exceptional 10.5% |
| Latvians | 99.8 /100 | #18 | Exceptional 10.5% |
| Immigrants | Scotland | 99.7 /100 | #19 | Exceptional 10.6% |
| Immigrants | North Macedonia | 99.7 /100 | #20 | Exceptional 10.6% |
| Luxembourgers | 99.7 /100 | #21 | Exceptional 10.6% |
| Eastern Europeans | 99.7 /100 | #22 | Exceptional 10.6% |
| Swedes | 99.7 /100 | #23 | Exceptional 10.6% |
| Italians | 99.7 /100 | #24 | Exceptional 10.6% |
| Croatians | 99.6 /100 | #25 | Exceptional 10.6% |
| Burmese | 99.6 /100 | #26 | Exceptional 10.7% |
| Immigrants | Northern Europe | 99.6 /100 | #27 | Exceptional 10.7% |
| Immigrants | Korea | 99.5 /100 | #28 | Exceptional 10.7% |