Immigrants from Oceania vs Yakama Female Poverty

COMPARE

Immigrants from Oceania
Race
Ancestry
AfghanAfricanAlaska NativeAlaskan AthabascanAlbanianAleutAlsatianAmericanApacheArabArapahoArgentineanArmenianAssyrian/Chaldean/SyriacAustralianAustrianBahamianBangladeshiBarbadianBasqueBelgianBelizeanBermudanBhutaneseBlackfeetBolivianBrazilianBritishBritish West IndianBulgarianBurmeseCajunCambodianCanadianCape VerdeanCarpatho RusynCelticCentral AmericanCentral American IndianCherokeeCheyenneChickasawChileanChineseChippewaChoctawColombianColvilleComancheCosta RicanCreeCreekCroatianCrowCubanCypriotCzechCzechoslovakianDanishDelawareDominicanDutchDutch West IndianEastern EuropeanEcuadorianEgyptianEnglishEstonianEthiopianEuropeanFijianFilipinoFinnishFrenchFrench American IndianFrench CanadianGermanGerman RussianGhanaianGreekGuamanian/ChamorroGuatemalanGuyaneseHaitianHmongHonduranHopiHoumaHungarianIcelanderIndian (Asian)IndonesianInupiatIranianIraqiIrishIroquoisIsraeliItalianJamaicanJapaneseJordanianKenyanKiowaKoreanLaotianLatvianLebaneseLiberianLithuanianLumbeeLuxembourgerMacedonianMalaysianMalteseMarshalleseMenomineeMexicanMexican American IndianMongolianMoroccanNative HawaiianNavajoNepaleseNew ZealanderNicaraguanNigerianNorthern EuropeanNorwegianOkinawanOsageOttawaPaiutePakistaniPalestinianPanamanianParaguayanPennsylvania GermanPeruvianPimaPolishPortuguesePotawatomiPuebloPuerto RicanPuget Sound SalishRomanianRussianSalvadoranSamoanScandinavianScotch-IrishScottishSeminoleSenegaleseSerbianShoshoneSierra LeoneanSiouxSlavicSlovakSloveneSomaliSouth AfricanSouth AmericanSouth American IndianSoviet UnionSpaniardSpanishSpanish AmericanSpanish American IndianSri LankanSubsaharan AfricanSudaneseSwedishSwissSyrianTaiwaneseThaiTlingit-HaidaTohono O'OdhamTonganTrinidadian and TobagonianTsimshianTurkishU.S. Virgin IslanderUgandanUkrainianUruguayanUteVenezuelanVietnameseWelshWest IndianYaquiYugoslavianYumanYup'ikZimbabwean
Immigration
NonimmigrantsImmigrantsAfghanistanAfricaAlbaniaArgentinaArmeniaAsiaAustraliaAustriaBahamasBangladeshBarbadosBelarusBelgiumBelizeBoliviaBosnia and HerzegovinaBrazilBulgariaBurma/MyanmarCabo VerdeCambodiaCameroonCanadaCaribbeanCentral AmericaChileChinaColombiaCongoCosta RicaCroatiaCubaCzechoslovakiaDenmarkDominicaDominican RepublicEastern AfricaEastern AsiaEastern EuropeEcuadorEgyptEl SalvadorEnglandEritreaEthiopiaEuropeFijiFranceGermanyGhanaGreeceGrenadaGuatemalaGuyanaHaitiHondurasHong KongHungaryIndiaIndonesiaIranIraqIrelandIsraelItalyJamaicaJapanJordanKazakhstanKenyaKoreaKuwaitLaosLatin AmericaLatviaLebanonLiberiaLithuaniaMalaysiaMexicoMicronesiaMiddle AfricaMoldovaMoroccoNepalNetherlandsNicaraguaNigeriaNorth AmericaNorth MacedoniaNorthern AfricaNorthern EuropeNorwayOceaniaPakistanPanamaPeruPhilippinesPolandPortugalRomaniaRussiaSaudi ArabiaScotlandSenegalSerbiaSierra LeoneSingaporeSomaliaSouth AfricaSouth AmericaSouth Central AsiaSouth Eastern AsiaSouthern EuropeSpainSri LankaSt. Vincent and the GrenadinesSudanSwedenSwitzerlandSyriaTaiwanThailandTrinidad and TobagoTurkeyUgandaUkraineUruguayUzbekistanVenezuelaVietnamWest IndiesWestern AfricaWestern AsiaWestern EuropeYemenZaireZimbabweAzores
Yakama
Race
Ancestry
AfghanAfricanAlaska NativeAlaskan AthabascanAlbanianAleutAlsatianAmericanApacheArabArapahoArgentineanArmenianAssyrian/Chaldean/SyriacAustralianAustrianBahamianBangladeshiBarbadianBasqueBelgianBelizeanBermudanBhutaneseBlackfeetBolivianBrazilianBritishBritish West IndianBulgarianBurmeseCajunCambodianCanadianCape VerdeanCarpatho RusynCelticCentral AmericanCentral American IndianCherokeeCheyenneChickasawChileanChineseChippewaChoctawColombianColvilleComancheCosta RicanCreeCreekCroatianCrowCubanCypriotCzechCzechoslovakianDanishDelawareDominicanDutchDutch West IndianEastern EuropeanEcuadorianEgyptianEnglishEstonianEthiopianEuropeanFijianFilipinoFinnishFrenchFrench American IndianFrench CanadianGermanGerman RussianGhanaianGreekGuamanian/ChamorroGuatemalanGuyaneseHaitianHmongHonduranHopiHoumaHungarianIcelanderIndian (Asian)IndonesianInupiatIranianIraqiIrishIroquoisIsraeliItalianJamaicanJapaneseJordanianKenyanKiowaKoreanLaotianLatvianLebaneseLiberianLithuanianLumbeeLuxembourgerMacedonianMalaysianMalteseMarshalleseMenomineeMexicanMexican American IndianMongolianMoroccanNative HawaiianNavajoNepaleseNew ZealanderNicaraguanNigerianNorthern EuropeanNorwegianOkinawanOsageOttawaPaiutePakistaniPalestinianPanamanianParaguayanPennsylvania GermanPeruvianPimaPolishPortuguesePotawatomiPuebloPuerto RicanPuget Sound SalishRomanianRussianSalvadoranSamoanScandinavianScotch-IrishScottishSeminoleSenegaleseSerbianShoshoneSierra LeoneanSiouxSlavicSlovakSloveneSomaliSouth AfricanSouth AmericanSouth American IndianSoviet UnionSpaniardSpanishSpanish AmericanSpanish American IndianSri LankanSubsaharan AfricanSudaneseSwedishSwissSyrianTaiwaneseThaiTlingit-HaidaTohono O'OdhamTonganTrinidadian and TobagonianTsimshianTurkishU.S. Virgin IslanderUgandanUkrainianUruguayanUteVenezuelanVietnameseWelshWest IndianYakamaYaquiYugoslavianYumanYup'ikZimbabwean
Immigration
NonimmigrantsImmigrantsAfghanistanAfricaAlbaniaArgentinaArmeniaAsiaAustraliaAustriaBahamasBangladeshBarbadosBelarusBelgiumBelizeBoliviaBosnia and HerzegovinaBrazilBulgariaBurma/MyanmarCabo VerdeCambodiaCameroonCanadaCaribbeanCentral AmericaChileChinaColombiaCongoCosta RicaCroatiaCubaCzechoslovakiaDenmarkDominicaDominican RepublicEastern AfricaEastern AsiaEastern EuropeEcuadorEgyptEl SalvadorEnglandEritreaEthiopiaEuropeFijiFranceGermanyGhanaGreeceGrenadaGuatemalaGuyanaHaitiHondurasHong KongHungaryIndiaIndonesiaIranIraqIrelandIsraelItalyJamaicaJapanJordanKazakhstanKenyaKoreaKuwaitLaosLatin AmericaLatviaLebanonLiberiaLithuaniaMalaysiaMexicoMicronesiaMiddle AfricaMoldovaMoroccoNepalNetherlandsNicaraguaNigeriaNorth AmericaNorth MacedoniaNorthern AfricaNorthern EuropeNorwayPakistanPanamaPeruPhilippinesPolandPortugalRomaniaRussiaSaudi ArabiaScotlandSenegalSerbiaSierra LeoneSingaporeSomaliaSouth AfricaSouth AmericaSouth Central AsiaSouth Eastern AsiaSouthern EuropeSpainSri LankaSt. Vincent and the GrenadinesSudanSwedenSwitzerlandSyriaTaiwanThailandTrinidad and TobagoTurkeyUgandaUkraineUruguayUzbekistanVenezuelaVietnamWest IndiesWestern AfricaWestern AsiaWestern EuropeYemenZaireZimbabweAzores
Female Poverty
Income
Poverty
Unemployment
Labor Participation
Family Structure
Vehicle Availability
Education Level
Disability

Female Poverty Comparison

Immigrants from Oceania

Yakama

Average
Tragic
13.3%
FEMALE POVERTY
59.7/ 100
METRIC RATING
166th/ 347
METRIC RANK
18.0%
FEMALE POVERTY
0.0/ 100
METRIC RATING
327th/ 347
METRIC RANK

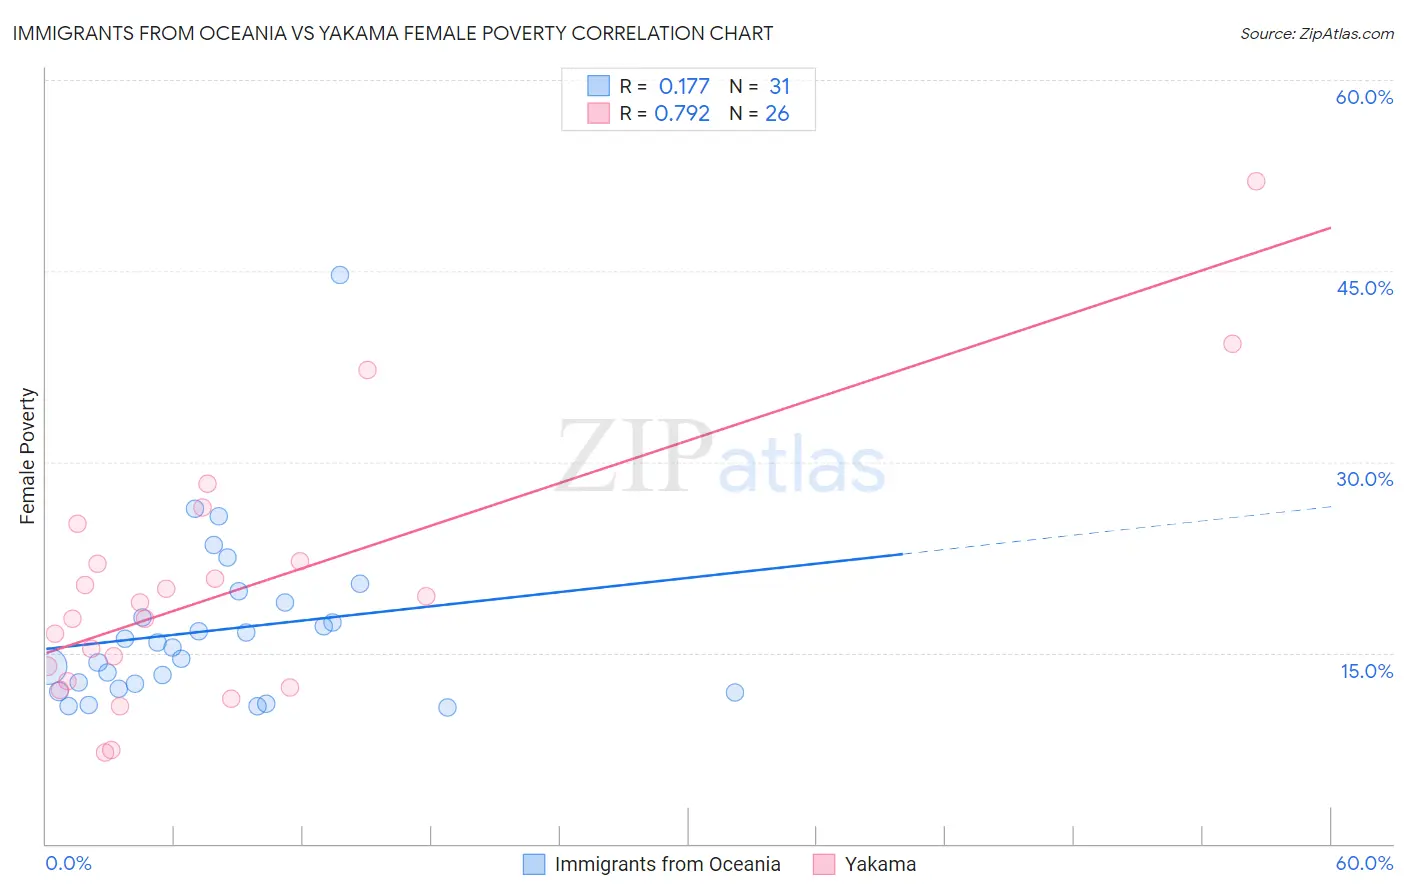
Immigrants from Oceania vs Yakama Female Poverty Correlation Chart

The statistical analysis conducted on geographies consisting of 305,339,012 people shows a poor positive correlation between the proportion of Immigrants from Oceania and poverty level among females in the United States with a correlation coefficient (R) of 0.177 and weighted average of 13.3%. Similarly, the statistical analysis conducted on geographies consisting of 19,917,707 people shows a strong positive correlation between the proportion of Yakama and poverty level among females in the United States with a correlation coefficient (R) of 0.792 and weighted average of 18.0%, a difference of 35.5%.
Immigrants from Oceania vs Yakama Female Poverty

Female Poverty Correlation Summary

MeasurementImmigrants from OceaniaYakama
Minimum10.7%7.1%
Maximum44.6%52.1%
Range33.9%44.9%
Mean16.8%20.1%
Median15.5%18.4%
Interquartile 25% (IQ1)12.2%12.8%
Interquartile 75% (IQ3)19.0%22.2%
Interquartile Range (IQR)6.8%9.5%
Standard Deviation (Sample)6.8%10.2%
Standard Deviation (Population)6.7%10.0%

Similar Demographics by Female Poverty

Demographics Similar to Immigrants from Oceania by Female Poverty

In terms of female poverty, the demographic groups most similar to Immigrants from Oceania are Scotch-Irish (13.3%, a difference of 0.24%), Immigrants from Chile (13.3%, a difference of 0.24%), Ethiopian (13.3%, a difference of 0.26%), Guamanian/Chamorro (13.3%, a difference of 0.27%), and Immigrants from Albania (13.3%, a difference of 0.27%).
DemographicsRating | RankFemale Poverty
Costa Ricans
63.6
/100
|
#159
Good
13.3%
Immigrants | Nepal
62.7
/100
|
#160
Good
13.3%
Immigrants | Ethiopia
62.5
/100
|
#161
Good
13.3%
Guamanians/Chamorros
62.4
/100
|
#162
Good
13.3%
Immigrants | Albania
62.4
/100
|
#163
Good
13.3%
Ethiopians
62.3
/100
|
#164
Good
13.3%
Scotch-Irish
62.1
/100
|
#165
Good
13.3%
Immigrants | Oceania
59.7
/100
|
#166
Average
13.3%
Immigrants | Chile
57.4
/100
|
#167
Average
13.3%
Aleuts
56.7
/100
|
#168
Average
13.4%
Lebanese
55.9
/100
|
#169
Average
13.4%
Colombians
55.7
/100
|
#170
Average
13.4%
Whites/Caucasians
54.6
/100
|
#171
Average
13.4%
Mongolians
53.6
/100
|
#172
Average
13.4%
Immigrants | Afghanistan
50.8
/100
|
#173
Average
13.4%

Demographics Similar to Yakama by Female Poverty

In terms of female poverty, the demographic groups most similar to Yakama are Central American Indian (18.0%, a difference of 0.10%), Colville (17.8%, a difference of 1.6%), Immigrants from Honduras (17.7%, a difference of 1.8%), Paiute (17.7%, a difference of 2.0%), and Menominee (17.6%, a difference of 2.6%).
DemographicsRating | RankFemale Poverty
Immigrants | Dominica
0.0
/100
|
#320
Tragic
17.5%
Arapaho
0.0
/100
|
#321
Tragic
17.5%
Menominee
0.0
/100
|
#322
Tragic
17.6%
Paiute
0.0
/100
|
#323
Tragic
17.7%
Immigrants | Honduras
0.0
/100
|
#324
Tragic
17.7%
Colville
0.0
/100
|
#325
Tragic
17.8%
Central American Indians
0.0
/100
|
#326
Tragic
18.0%
Yakama
0.0
/100
|
#327
Tragic
18.0%
Blacks/African Americans
0.0
/100
|
#328
Tragic
18.6%
Kiowa
0.0
/100
|
#329
Tragic
18.6%
Dominicans
0.0
/100
|
#330
Tragic
19.1%
Natives/Alaskans
0.0
/100
|
#331
Tragic
19.2%
Apache
0.0
/100
|
#332
Tragic
19.2%
Immigrants | Dominican Republic
0.0
/100
|
#333
Tragic
19.3%
Houma
0.0
/100
|
#334
Tragic
20.0%