Immigrants from Oceania vs Yakama Unemployment
COMPARE
Immigrants from Oceania
Yakama
Unemployment
Unemployment Comparison
Immigrants from Oceania
Yakama
5.2%
UNEMPLOYMENT
65.2/ 100
METRIC RATING
161st/ 347
METRIC RANK
7.3%
UNEMPLOYMENT
0.0/ 100
METRIC RATING
330th/ 347
METRIC RANK
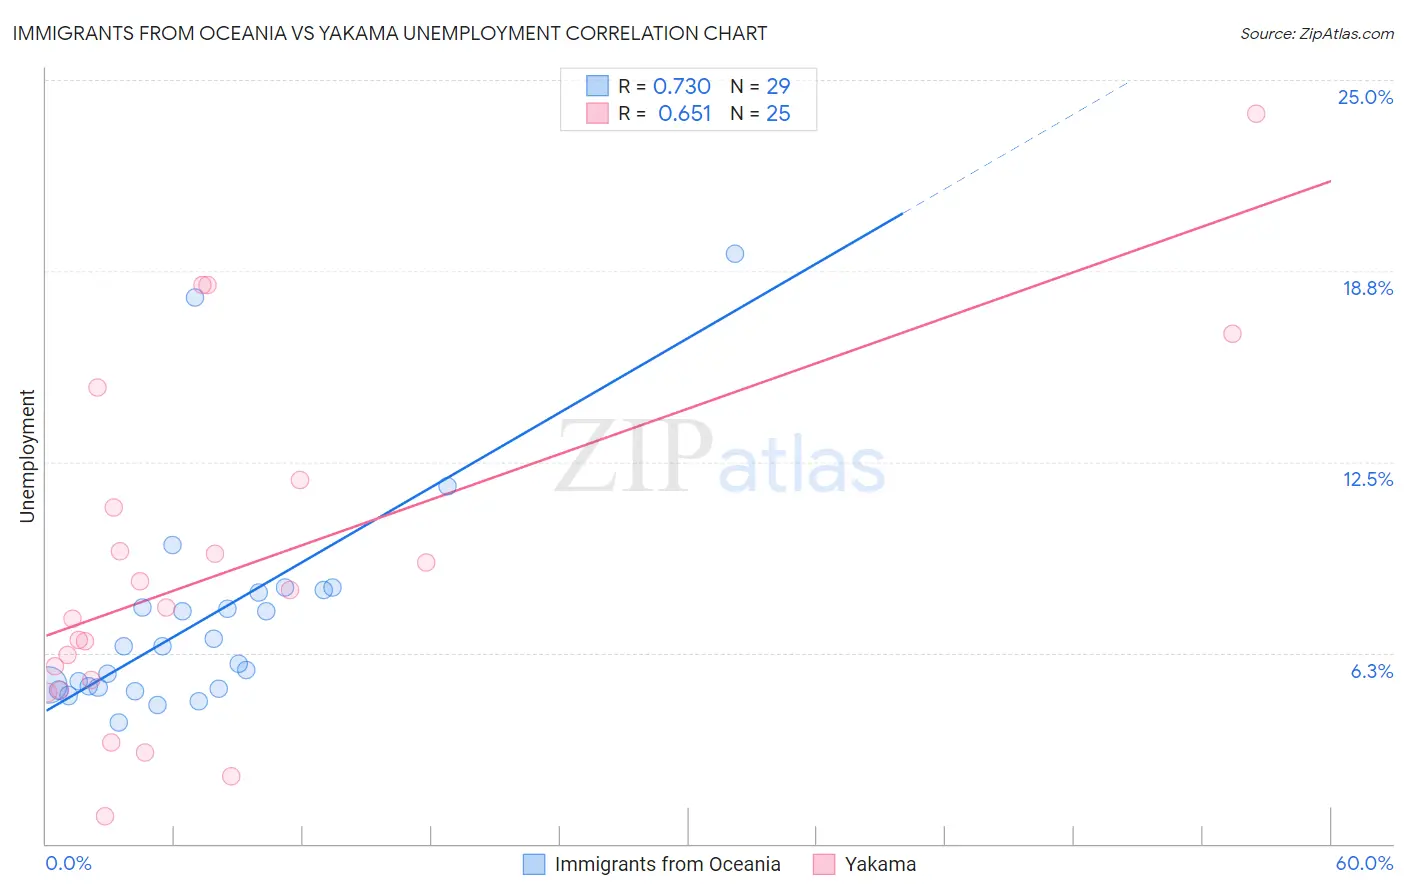
Immigrants from Oceania vs Yakama Unemployment Correlation Chart
The statistical analysis conducted on geographies consisting of 305,291,024 people shows a strong positive correlation between the proportion of Immigrants from Oceania and unemployment in the United States with a correlation coefficient (R) of 0.730 and weighted average of 5.2%. Similarly, the statistical analysis conducted on geographies consisting of 19,909,925 people shows a significant positive correlation between the proportion of Yakama and unemployment in the United States with a correlation coefficient (R) of 0.651 and weighted average of 7.3%, a difference of 40.8%.
Unemployment Correlation Summary
| Measurement | Immigrants from Oceania | Yakama |
| Minimum | 4.0% | 0.90% |
| Maximum | 19.3% | 23.9% |
| Range | 15.3% | 23.0% |
| Mean | 7.4% | 9.0% |
| Median | 6.4% | 7.7% |
| Interquartile 25% (IQ1) | 5.1% | 5.2% |
| Interquartile 75% (IQ3) | 8.3% | 11.5% |
| Interquartile Range (IQR) | 3.2% | 6.3% |
| Standard Deviation (Sample) | 3.6% | 5.6% |
| Standard Deviation (Population) | 3.5% | 5.5% |
Similar Demographics by Unemployment
Demographics Similar to Immigrants from Oceania by Unemployment
In terms of unemployment, the demographic groups most similar to Immigrants from Oceania are Spanish (5.2%, a difference of 0.010%), Immigrants from Zaire (5.2%, a difference of 0.030%), Immigrants from Colombia (5.2%, a difference of 0.040%), Laotian (5.2%, a difference of 0.080%), and Immigrants from Egypt (5.2%, a difference of 0.10%).
| Demographics | Rating | Rank | Unemployment |
| Immigrants | China | 74.7 /100 | #154 | Good 5.2% |
| Immigrants | Northern Africa | 71.3 /100 | #155 | Good 5.2% |
| Immigrants | Kazakhstan | 70.4 /100 | #156 | Good 5.2% |
| Sri Lankans | 69.5 /100 | #157 | Good 5.2% |
| Immigrants | Egypt | 66.7 /100 | #158 | Good 5.2% |
| Immigrants | Russia | 66.6 /100 | #159 | Good 5.2% |
| Laotians | 66.3 /100 | #160 | Good 5.2% |
| Immigrants | Oceania | 65.2 /100 | #161 | Good 5.2% |
| Spanish | 65.1 /100 | #162 | Good 5.2% |
| Immigrants | Zaire | 64.7 /100 | #163 | Good 5.2% |
| Immigrants | Colombia | 64.7 /100 | #164 | Good 5.2% |
| Immigrants | Brazil | 63.1 /100 | #165 | Good 5.2% |
| Immigrants | Indonesia | 61.2 /100 | #166 | Good 5.2% |
| Colombians | 61.1 /100 | #167 | Good 5.2% |
| Uruguayans | 60.2 /100 | #168 | Good 5.2% |
Demographics Similar to Yakama by Unemployment
In terms of unemployment, the demographic groups most similar to Yakama are Dominican (7.4%, a difference of 0.33%), Sioux (7.4%, a difference of 0.76%), Immigrants from Dominican Republic (7.4%, a difference of 0.82%), Alaska Native (7.2%, a difference of 1.3%), and Apache (7.4%, a difference of 1.3%).
| Demographics | Rating | Rank | Unemployment |
| Immigrants | Grenada | 0.0 /100 | #323 | Tragic 6.9% |
| Immigrants | Armenia | 0.0 /100 | #324 | Tragic 7.0% |
| Natives/Alaskans | 0.0 /100 | #325 | Tragic 7.0% |
| Paiute | 0.0 /100 | #326 | Tragic 7.1% |
| Pueblo | 0.0 /100 | #327 | Tragic 7.2% |
| Tsimshian | 0.0 /100 | #328 | Tragic 7.2% |
| Alaska Natives | 0.0 /100 | #329 | Tragic 7.2% |
| Yakama | 0.0 /100 | #330 | Tragic 7.3% |
| Dominicans | 0.0 /100 | #331 | Tragic 7.4% |
| Sioux | 0.0 /100 | #332 | Tragic 7.4% |
| Immigrants | Dominican Republic | 0.0 /100 | #333 | Tragic 7.4% |
| Apache | 0.0 /100 | #334 | Tragic 7.4% |
| Alaskan Athabascans | 0.0 /100 | #335 | Tragic 7.7% |
| Immigrants | Yemen | 0.0 /100 | #336 | Tragic 7.7% |
| Cheyenne | 0.0 /100 | #337 | Tragic 8.0% |