Immigrants from Oceania vs Yakama Female Poverty Among 18-24 Year Olds
COMPARE
Immigrants from Oceania
Yakama
Female Poverty Among 18-24 Year Olds
Female Poverty Among 18-24 Year Olds Comparison
Immigrants from Oceania
Yakama
19.7%
FEMALE POVERTY AMONG 18-24 YEAR OLDS
81.2/ 100
METRIC RATING
149th/ 347
METRIC RANK
25.3%
FEMALE POVERTY AMONG 18-24 YEAR OLDS
0.0/ 100
METRIC RATING
326th/ 347
METRIC RANK
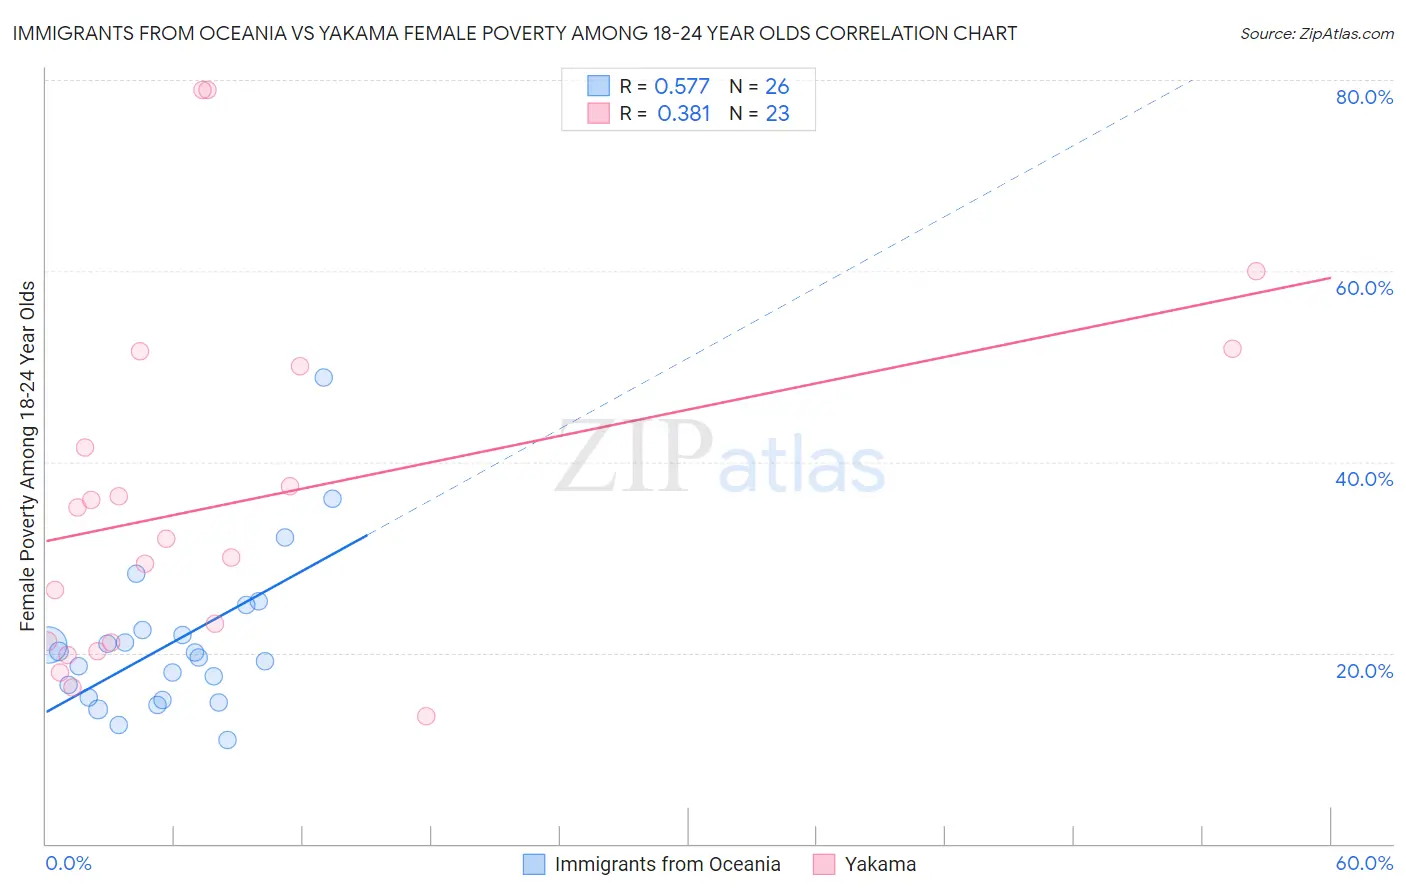
Immigrants from Oceania vs Yakama Female Poverty Among 18-24 Year Olds Correlation Chart
The statistical analysis conducted on geographies consisting of 299,979,017 people shows a substantial positive correlation between the proportion of Immigrants from Oceania and poverty level among females between the ages 18 and 24 in the United States with a correlation coefficient (R) of 0.577 and weighted average of 19.7%. Similarly, the statistical analysis conducted on geographies consisting of 19,755,262 people shows a mild positive correlation between the proportion of Yakama and poverty level among females between the ages 18 and 24 in the United States with a correlation coefficient (R) of 0.381 and weighted average of 25.3%, a difference of 28.4%.
Female Poverty Among 18-24 Year Olds Correlation Summary
| Measurement | Immigrants from Oceania | Yakama |
| Minimum | 10.9% | 13.3% |
| Maximum | 48.8% | 78.9% |
| Range | 37.9% | 65.6% |
| Mean | 21.1% | 36.0% |
| Median | 19.8% | 31.9% |
| Interquartile 25% (IQ1) | 15.3% | 21.1% |
| Interquartile 75% (IQ3) | 22.4% | 50.0% |
| Interquartile Range (IQR) | 7.0% | 28.9% |
| Standard Deviation (Sample) | 8.1% | 18.5% |
| Standard Deviation (Population) | 7.9% | 18.1% |
Similar Demographics by Female Poverty Among 18-24 Year Olds
Demographics Similar to Immigrants from Oceania by Female Poverty Among 18-24 Year Olds
In terms of female poverty among 18-24 year olds, the demographic groups most similar to Immigrants from Oceania are Immigrants from Latin America (19.7%, a difference of 0.010%), Syrian (19.8%, a difference of 0.080%), Immigrants from Eastern Asia (19.8%, a difference of 0.12%), Immigrants from Austria (19.7%, a difference of 0.16%), and Yugoslavian (19.8%, a difference of 0.17%).
| Demographics | Rating | Rank | Female Poverty Among 18-24 Year Olds |
| Panamanians | 84.6 /100 | #142 | Excellent 19.7% |
| Slavs | 84.4 /100 | #143 | Excellent 19.7% |
| Immigrants | Northern Africa | 84.1 /100 | #144 | Excellent 19.7% |
| Canadians | 83.8 /100 | #145 | Excellent 19.7% |
| Immigrants | Bosnia and Herzegovina | 83.6 /100 | #146 | Excellent 19.7% |
| Immigrants | Austria | 83.1 /100 | #147 | Excellent 19.7% |
| Immigrants | Latin America | 81.3 /100 | #148 | Excellent 19.7% |
| Immigrants | Oceania | 81.2 /100 | #149 | Excellent 19.7% |
| Syrians | 80.2 /100 | #150 | Excellent 19.8% |
| Immigrants | Eastern Asia | 79.7 /100 | #151 | Good 19.8% |
| Yugoslavians | 79.0 /100 | #152 | Good 19.8% |
| Immigrants | Japan | 78.1 /100 | #153 | Good 19.8% |
| Immigrants | Zimbabwe | 76.7 /100 | #154 | Good 19.8% |
| Hungarians | 76.6 /100 | #155 | Good 19.8% |
| Immigrants | Belgium | 76.4 /100 | #156 | Good 19.8% |
Demographics Similar to Yakama by Female Poverty Among 18-24 Year Olds
In terms of female poverty among 18-24 year olds, the demographic groups most similar to Yakama are Ute (25.4%, a difference of 0.23%), Immigrants from Saudi Arabia (25.3%, a difference of 0.25%), Native/Alaskan (25.4%, a difference of 0.29%), German Russian (25.2%, a difference of 0.68%), and Arapaho (25.2%, a difference of 0.71%).
| Demographics | Rating | Rank | Female Poverty Among 18-24 Year Olds |
| Dutch West Indians | 0.0 /100 | #319 | Tragic 24.5% |
| Immigrants | Congo | 0.0 /100 | #320 | Tragic 24.6% |
| Immigrants | Zaire | 0.0 /100 | #321 | Tragic 25.1% |
| Somalis | 0.0 /100 | #322 | Tragic 25.1% |
| Arapaho | 0.0 /100 | #323 | Tragic 25.2% |
| German Russians | 0.0 /100 | #324 | Tragic 25.2% |
| Immigrants | Saudi Arabia | 0.0 /100 | #325 | Tragic 25.3% |
| Yakama | 0.0 /100 | #326 | Tragic 25.3% |
| Ute | 0.0 /100 | #327 | Tragic 25.4% |
| Natives/Alaskans | 0.0 /100 | #328 | Tragic 25.4% |
| Cajuns | 0.0 /100 | #329 | Tragic 25.7% |
| Immigrants | Somalia | 0.0 /100 | #330 | Tragic 25.7% |
| Chippewa | 0.0 /100 | #331 | Tragic 25.9% |
| Houma | 0.0 /100 | #332 | Tragic 26.2% |
| Apache | 0.0 /100 | #333 | Tragic 26.3% |