Immigrants from Grenada vs Yakama Female Poverty
COMPARE
Immigrants from Grenada
Yakama
Female Poverty
Female Poverty Comparison
Immigrants from Grenada
Yakama
16.8%
FEMALE POVERTY
0.0/ 100
METRIC RATING
305th/ 347
METRIC RANK
18.0%
FEMALE POVERTY
0.0/ 100
METRIC RATING
327th/ 347
METRIC RANK
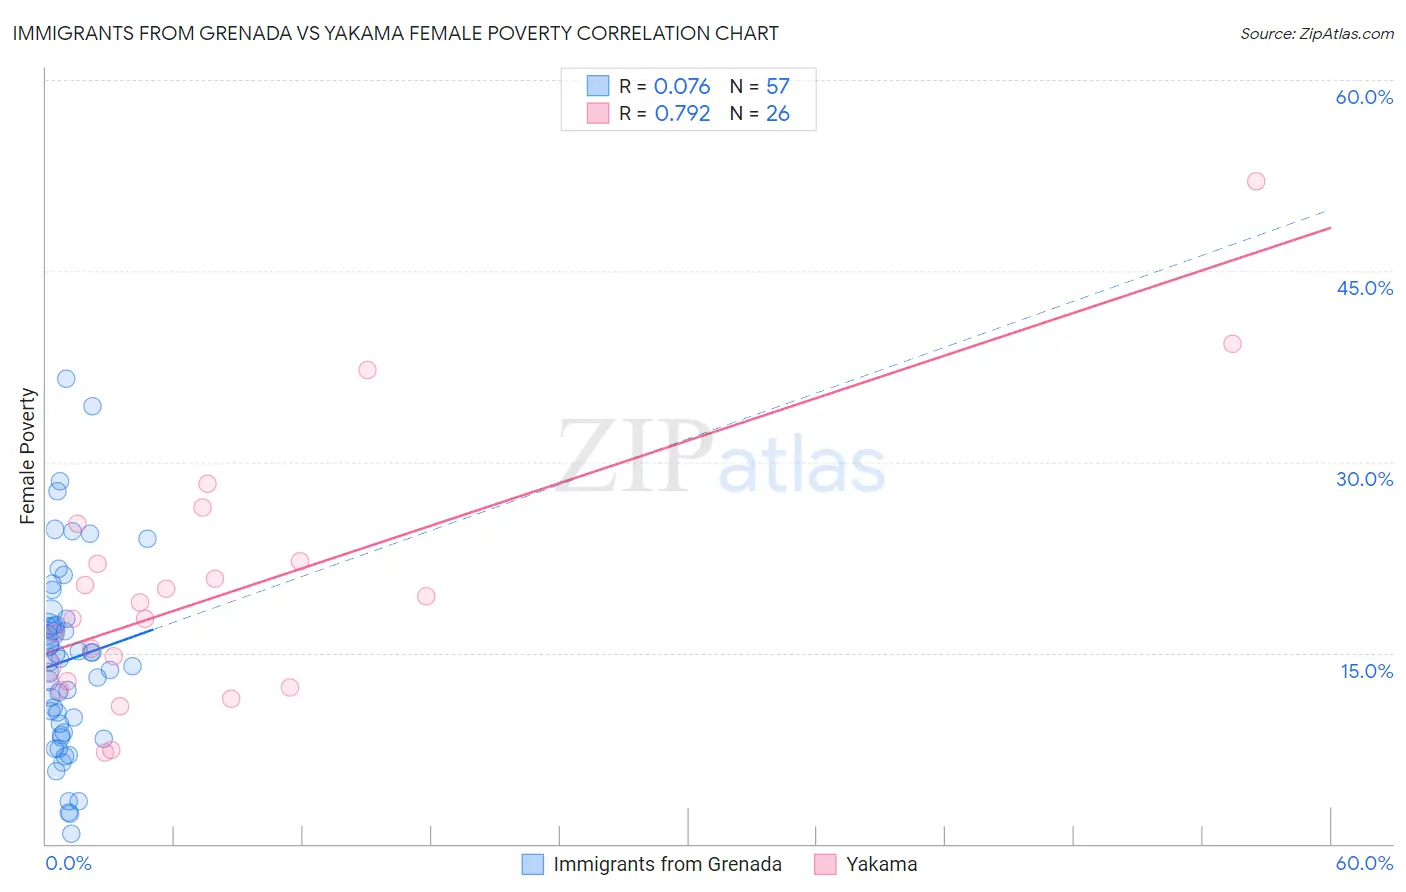
Immigrants from Grenada vs Yakama Female Poverty Correlation Chart
The statistical analysis conducted on geographies consisting of 67,188,736 people shows a slight positive correlation between the proportion of Immigrants from Grenada and poverty level among females in the United States with a correlation coefficient (R) of 0.076 and weighted average of 16.8%. Similarly, the statistical analysis conducted on geographies consisting of 19,917,707 people shows a strong positive correlation between the proportion of Yakama and poverty level among females in the United States with a correlation coefficient (R) of 0.792 and weighted average of 18.0%, a difference of 7.3%.
Female Poverty Correlation Summary
| Measurement | Immigrants from Grenada | Yakama |
| Minimum | 0.74% | 7.1% |
| Maximum | 36.5% | 52.1% |
| Range | 35.8% | 44.9% |
| Mean | 14.4% | 20.1% |
| Median | 14.3% | 18.4% |
| Interquartile 25% (IQ1) | 8.6% | 12.8% |
| Interquartile 75% (IQ3) | 17.4% | 22.2% |
| Interquartile Range (IQR) | 8.8% | 9.5% |
| Standard Deviation (Sample) | 7.6% | 10.2% |
| Standard Deviation (Population) | 7.5% | 10.0% |
Similar Demographics by Female Poverty
Demographics Similar to Immigrants from Grenada by Female Poverty
In terms of female poverty, the demographic groups most similar to Immigrants from Grenada are Immigrants from Central America (16.8%, a difference of 0.0%), Choctaw (16.8%, a difference of 0.070%), Immigrants from Caribbean (16.9%, a difference of 0.27%), Seminole (16.9%, a difference of 0.39%), and African (16.9%, a difference of 0.45%).
| Demographics | Rating | Rank | Female Poverty |
| Somalis | 0.0 /100 | #298 | Tragic 16.6% |
| Hispanics or Latinos | 0.0 /100 | #299 | Tragic 16.6% |
| Bahamians | 0.0 /100 | #300 | Tragic 16.6% |
| Guatemalans | 0.0 /100 | #301 | Tragic 16.7% |
| Chippewa | 0.0 /100 | #302 | Tragic 16.7% |
| Choctaw | 0.0 /100 | #303 | Tragic 16.8% |
| Immigrants | Central America | 0.0 /100 | #304 | Tragic 16.8% |
| Immigrants | Grenada | 0.0 /100 | #305 | Tragic 16.8% |
| Immigrants | Caribbean | 0.0 /100 | #306 | Tragic 16.9% |
| Seminole | 0.0 /100 | #307 | Tragic 16.9% |
| Africans | 0.0 /100 | #308 | Tragic 16.9% |
| Immigrants | Mexico | 0.0 /100 | #309 | Tragic 17.0% |
| Creek | 0.0 /100 | #310 | Tragic 17.0% |
| Immigrants | Guatemala | 0.0 /100 | #311 | Tragic 17.0% |
| Immigrants | Somalia | 0.0 /100 | #312 | Tragic 17.0% |
Demographics Similar to Yakama by Female Poverty
In terms of female poverty, the demographic groups most similar to Yakama are Central American Indian (18.0%, a difference of 0.10%), Colville (17.8%, a difference of 1.6%), Immigrants from Honduras (17.7%, a difference of 1.8%), Paiute (17.7%, a difference of 2.0%), and Menominee (17.6%, a difference of 2.6%).
| Demographics | Rating | Rank | Female Poverty |
| Immigrants | Dominica | 0.0 /100 | #320 | Tragic 17.5% |
| Arapaho | 0.0 /100 | #321 | Tragic 17.5% |
| Menominee | 0.0 /100 | #322 | Tragic 17.6% |
| Paiute | 0.0 /100 | #323 | Tragic 17.7% |
| Immigrants | Honduras | 0.0 /100 | #324 | Tragic 17.7% |
| Colville | 0.0 /100 | #325 | Tragic 17.8% |
| Central American Indians | 0.0 /100 | #326 | Tragic 18.0% |
| Yakama | 0.0 /100 | #327 | Tragic 18.0% |
| Blacks/African Americans | 0.0 /100 | #328 | Tragic 18.6% |
| Kiowa | 0.0 /100 | #329 | Tragic 18.6% |
| Dominicans | 0.0 /100 | #330 | Tragic 19.1% |
| Natives/Alaskans | 0.0 /100 | #331 | Tragic 19.2% |
| Apache | 0.0 /100 | #332 | Tragic 19.2% |
| Immigrants | Dominican Republic | 0.0 /100 | #333 | Tragic 19.3% |
| Houma | 0.0 /100 | #334 | Tragic 20.0% |