Immigrants from North America vs Potawatomi Child Poverty Among Boys Under 16
COMPARE
Immigrants from North America
Potawatomi
Child Poverty Among Boys Under 16
Child Poverty Among Boys Under 16 Comparison
Immigrants from North America
Potawatomi
14.8%
CHILD POVERTY AMONG BOYS UNDER 16
97.1/ 100
METRIC RATING
88th/ 347
METRIC RANK
19.4%
CHILD POVERTY AMONG BOYS UNDER 16
0.2/ 100
METRIC RATING
258th/ 347
METRIC RANK
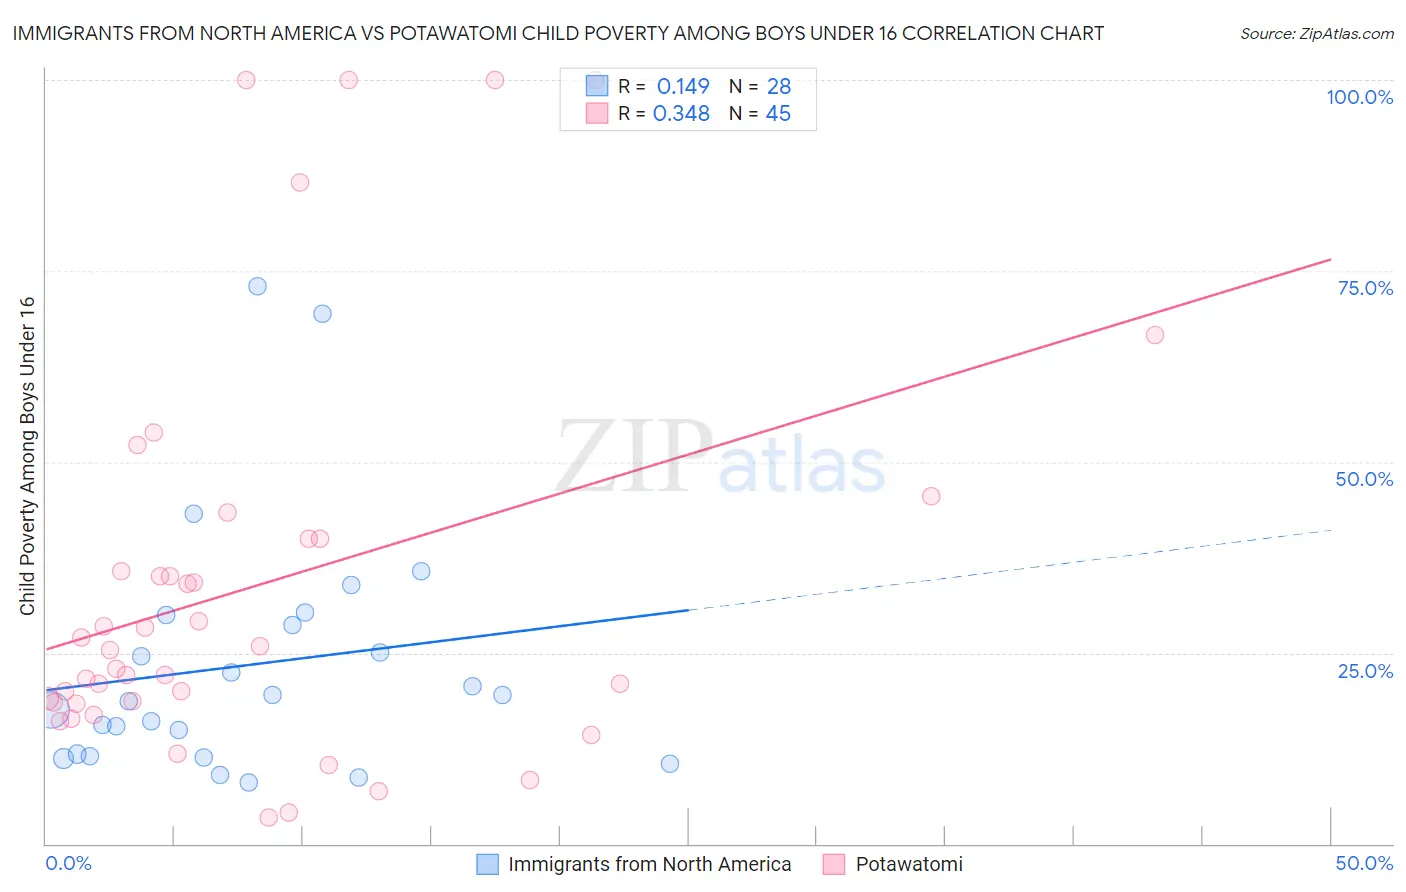
Immigrants from North America vs Potawatomi Child Poverty Among Boys Under 16 Correlation Chart
The statistical analysis conducted on geographies consisting of 451,303,762 people shows a poor positive correlation between the proportion of Immigrants from North America and poverty level among boys under the age of 16 in the United States with a correlation coefficient (R) of 0.149 and weighted average of 14.8%. Similarly, the statistical analysis conducted on geographies consisting of 117,214,140 people shows a mild positive correlation between the proportion of Potawatomi and poverty level among boys under the age of 16 in the United States with a correlation coefficient (R) of 0.348 and weighted average of 19.4%, a difference of 30.8%.
Child Poverty Among Boys Under 16 Correlation Summary
| Measurement | Immigrants from North America | Potawatomi |
| Minimum | 8.1% | 3.5% |
| Maximum | 72.9% | 100.0% |
| Range | 64.8% | 96.5% |
| Mean | 23.4% | 33.8% |
| Median | 19.1% | 25.4% |
| Interquartile 25% (IQ1) | 11.6% | 18.4% |
| Interquartile 75% (IQ3) | 29.3% | 40.0% |
| Interquartile Range (IQR) | 17.7% | 21.6% |
| Standard Deviation (Sample) | 16.2% | 26.3% |
| Standard Deviation (Population) | 15.9% | 26.0% |
Similar Demographics by Child Poverty Among Boys Under 16
Demographics Similar to Immigrants from North America by Child Poverty Among Boys Under 16
In terms of child poverty among boys under 16, the demographic groups most similar to Immigrants from North America are Northern European (14.8%, a difference of 0.020%), German (14.8%, a difference of 0.070%), Immigrants from Argentina (14.8%, a difference of 0.070%), Austrian (14.8%, a difference of 0.090%), and Taiwanese (14.8%, a difference of 0.13%).
| Demographics | Rating | Rank | Child Poverty Among Boys Under 16 |
| Immigrants | Canada | 97.6 /100 | #81 | Exceptional 14.7% |
| Ukrainians | 97.6 /100 | #82 | Exceptional 14.7% |
| Immigrants | South Africa | 97.4 /100 | #83 | Exceptional 14.8% |
| Swiss | 97.3 /100 | #84 | Exceptional 14.8% |
| Taiwanese | 97.3 /100 | #85 | Exceptional 14.8% |
| Germans | 97.2 /100 | #86 | Exceptional 14.8% |
| Northern Europeans | 97.2 /100 | #87 | Exceptional 14.8% |
| Immigrants | North America | 97.1 /100 | #88 | Exceptional 14.8% |
| Immigrants | Argentina | 97.1 /100 | #89 | Exceptional 14.8% |
| Austrians | 97.1 /100 | #90 | Exceptional 14.8% |
| Paraguayans | 96.8 /100 | #91 | Exceptional 14.9% |
| Argentineans | 96.7 /100 | #92 | Exceptional 14.9% |
| Sri Lankans | 96.7 /100 | #93 | Exceptional 14.9% |
| Immigrants | Italy | 96.7 /100 | #94 | Exceptional 14.9% |
| Finns | 96.5 /100 | #95 | Exceptional 14.9% |
Demographics Similar to Potawatomi by Child Poverty Among Boys Under 16
In terms of child poverty among boys under 16, the demographic groups most similar to Potawatomi are Mexican American Indian (19.4%, a difference of 0.020%), Spanish American (19.4%, a difference of 0.020%), Shoshone (19.4%, a difference of 0.12%), Immigrants from Ghana (19.4%, a difference of 0.13%), and Immigrants from Liberia (19.3%, a difference of 0.22%).
| Demographics | Rating | Rank | Child Poverty Among Boys Under 16 |
| French American Indians | 0.2 /100 | #251 | Tragic 19.2% |
| Immigrants | Western Africa | 0.2 /100 | #252 | Tragic 19.3% |
| Liberians | 0.2 /100 | #253 | Tragic 19.3% |
| Trinidadians and Tobagonians | 0.2 /100 | #254 | Tragic 19.3% |
| Ecuadorians | 0.2 /100 | #255 | Tragic 19.3% |
| Immigrants | Liberia | 0.2 /100 | #256 | Tragic 19.3% |
| Mexican American Indians | 0.2 /100 | #257 | Tragic 19.4% |
| Potawatomi | 0.2 /100 | #258 | Tragic 19.4% |
| Spanish Americans | 0.2 /100 | #259 | Tragic 19.4% |
| Shoshone | 0.2 /100 | #260 | Tragic 19.4% |
| Immigrants | Ghana | 0.2 /100 | #261 | Tragic 19.4% |
| Immigrants | Guyana | 0.1 /100 | #262 | Tragic 19.5% |
| Ottawa | 0.1 /100 | #263 | Tragic 19.5% |
| Iroquois | 0.1 /100 | #264 | Tragic 19.6% |
| Guyanese | 0.1 /100 | #265 | Tragic 19.6% |