Immigrants from Nepal vs Immigrants from Trinidad and Tobago Unemployment Among Ages 60 to 64 years
COMPARE
Immigrants from Nepal
Immigrants from Trinidad and Tobago
Unemployment Among Ages 60 to 64 years
Unemployment Among Ages 60 to 64 years Comparison
Immigrants from Nepal
Immigrants from Trinidad and Tobago
4.5%
UNEMPLOYMENT AMONG AGES 60 TO 64 YEARS
100.0/ 100
METRIC RATING
28th/ 347
METRIC RANK
5.3%
UNEMPLOYMENT AMONG AGES 60 TO 64 YEARS
0.0/ 100
METRIC RATING
290th/ 347
METRIC RANK
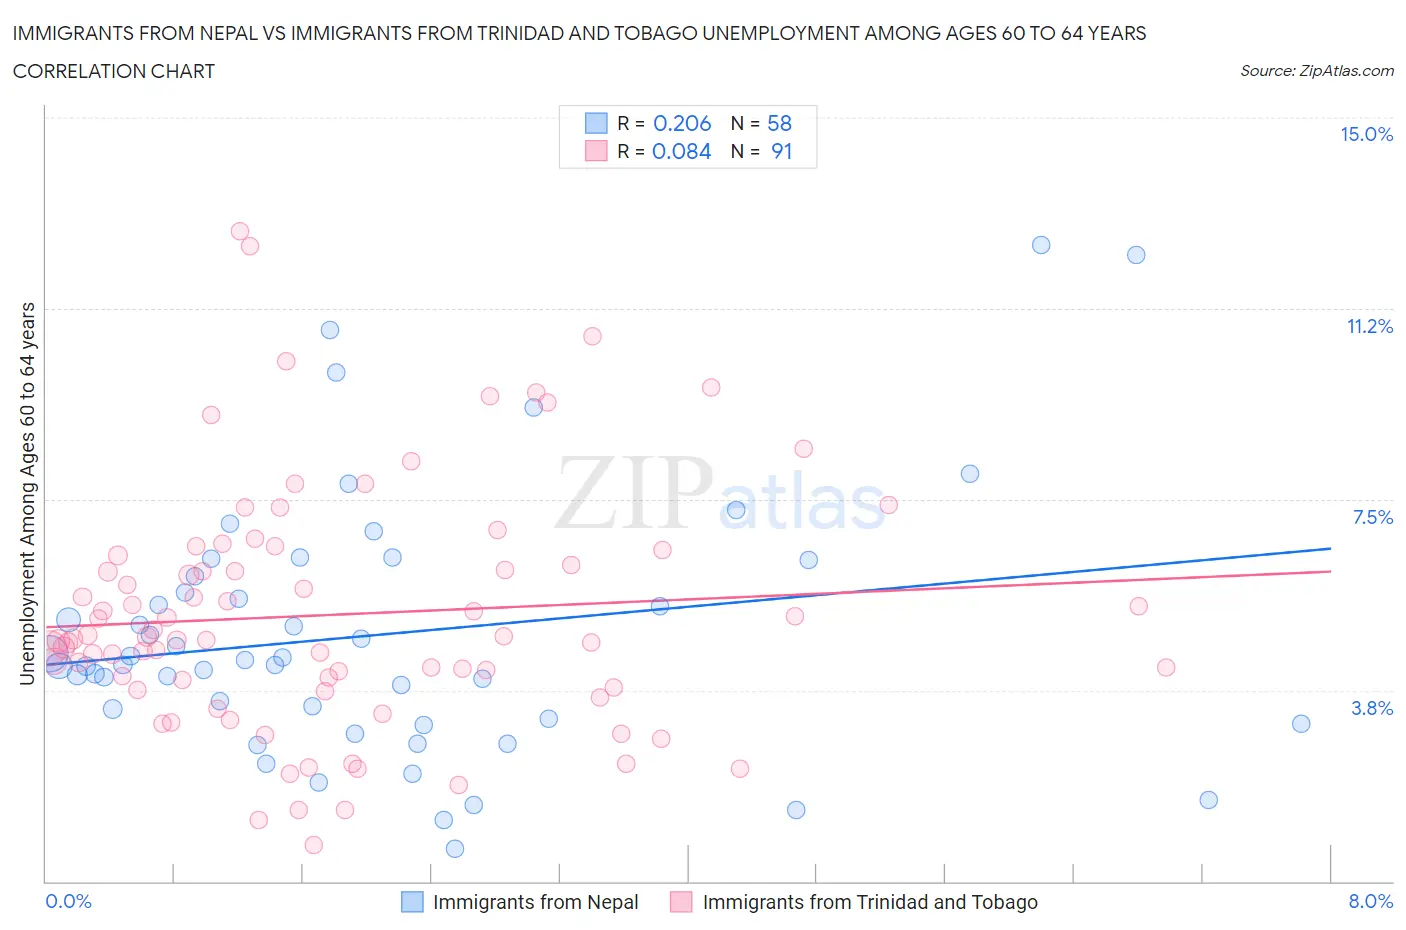
Immigrants from Nepal vs Immigrants from Trinidad and Tobago Unemployment Among Ages 60 to 64 years Correlation Chart
The statistical analysis conducted on geographies consisting of 176,465,127 people shows a weak positive correlation between the proportion of Immigrants from Nepal and unemployment rate among population between the ages 60 and 64 in the United States with a correlation coefficient (R) of 0.206 and weighted average of 4.5%. Similarly, the statistical analysis conducted on geographies consisting of 212,065,319 people shows a slight positive correlation between the proportion of Immigrants from Trinidad and Tobago and unemployment rate among population between the ages 60 and 64 in the United States with a correlation coefficient (R) of 0.084 and weighted average of 5.3%, a difference of 18.8%.
Unemployment Among Ages 60 to 64 years Correlation Summary
| Measurement | Immigrants from Nepal | Immigrants from Trinidad and Tobago |
| Minimum | 0.63% | 0.70% |
| Maximum | 12.5% | 12.8% |
| Range | 11.9% | 12.1% |
| Mean | 4.8% | 5.2% |
| Median | 4.3% | 4.8% |
| Interquartile 25% (IQ1) | 3.2% | 3.8% |
| Interquartile 75% (IQ3) | 6.0% | 6.4% |
| Interquartile Range (IQR) | 2.8% | 2.6% |
| Standard Deviation (Sample) | 2.5% | 2.4% |
| Standard Deviation (Population) | 2.5% | 2.4% |
Similar Demographics by Unemployment Among Ages 60 to 64 years
Demographics Similar to Immigrants from Nepal by Unemployment Among Ages 60 to 64 years
In terms of unemployment among ages 60 to 64 years, the demographic groups most similar to Immigrants from Nepal are Immigrants from Iraq (4.5%, a difference of 0.070%), Czech (4.4%, a difference of 0.16%), Cuban (4.5%, a difference of 0.23%), Immigrants from Venezuela (4.5%, a difference of 0.25%), and Yugoslavian (4.4%, a difference of 0.26%).
| Demographics | Rating | Rank | Unemployment Among Ages 60 to 64 years |
| Immigrants | Cabo Verde | 100.0 /100 | #21 | Exceptional 4.4% |
| Cape Verdeans | 100.0 /100 | #22 | Exceptional 4.4% |
| Immigrants | Zaire | 100.0 /100 | #23 | Exceptional 4.4% |
| Immigrants | Burma/Myanmar | 100.0 /100 | #24 | Exceptional 4.4% |
| Yugoslavians | 100.0 /100 | #25 | Exceptional 4.4% |
| Czechs | 100.0 /100 | #26 | Exceptional 4.4% |
| Immigrants | Iraq | 100.0 /100 | #27 | Exceptional 4.5% |
| Immigrants | Nepal | 100.0 /100 | #28 | Exceptional 4.5% |
| Cubans | 100.0 /100 | #29 | Exceptional 4.5% |
| Immigrants | Venezuela | 100.0 /100 | #30 | Exceptional 4.5% |
| Immigrants | Eritrea | 100.0 /100 | #31 | Exceptional 4.5% |
| Zimbabweans | 100.0 /100 | #32 | Exceptional 4.5% |
| Carpatho Rusyns | 100.0 /100 | #33 | Exceptional 4.5% |
| Belgians | 100.0 /100 | #34 | Exceptional 4.5% |
| Germans | 100.0 /100 | #35 | Exceptional 4.5% |
Demographics Similar to Immigrants from Trinidad and Tobago by Unemployment Among Ages 60 to 64 years
In terms of unemployment among ages 60 to 64 years, the demographic groups most similar to Immigrants from Trinidad and Tobago are Spanish American (5.3%, a difference of 0.030%), Trinidadian and Tobagonian (5.3%, a difference of 0.060%), Salvadoran (5.3%, a difference of 0.24%), Mexican American Indian (5.3%, a difference of 0.28%), and Hispanic or Latino (5.3%, a difference of 0.32%).
| Demographics | Rating | Rank | Unemployment Among Ages 60 to 64 years |
| Immigrants | Guatemala | 0.0 /100 | #283 | Tragic 5.3% |
| Taiwanese | 0.0 /100 | #284 | Tragic 5.3% |
| West Indians | 0.0 /100 | #285 | Tragic 5.3% |
| Mexican American Indians | 0.0 /100 | #286 | Tragic 5.3% |
| Salvadorans | 0.0 /100 | #287 | Tragic 5.3% |
| Trinidadians and Tobagonians | 0.0 /100 | #288 | Tragic 5.3% |
| Spanish Americans | 0.0 /100 | #289 | Tragic 5.3% |
| Immigrants | Trinidad and Tobago | 0.0 /100 | #290 | Tragic 5.3% |
| Hispanics or Latinos | 0.0 /100 | #291 | Tragic 5.3% |
| Immigrants | Latin America | 0.0 /100 | #292 | Tragic 5.3% |
| Immigrants | Israel | 0.0 /100 | #293 | Tragic 5.3% |
| Blacks/African Americans | 0.0 /100 | #294 | Tragic 5.3% |
| Armenians | 0.0 /100 | #295 | Tragic 5.3% |
| Jamaicans | 0.0 /100 | #296 | Tragic 5.3% |
| Osage | 0.0 /100 | #297 | Tragic 5.4% |