Immigrants from Nepal vs Immigrants from Trinidad and Tobago Female Poverty Among 25-34 Year Olds
COMPARE
Immigrants from Nepal
Immigrants from Trinidad and Tobago
Female Poverty Among 25-34 Year Olds
Female Poverty Among 25-34 Year Olds Comparison
Immigrants from Nepal
Immigrants from Trinidad and Tobago
12.8%
FEMALE POVERTY AMONG 25-34 YEAR OLDS
93.0/ 100
METRIC RATING
119th/ 347
METRIC RANK
14.0%
FEMALE POVERTY AMONG 25-34 YEAR OLDS
17.6/ 100
METRIC RATING
201st/ 347
METRIC RANK
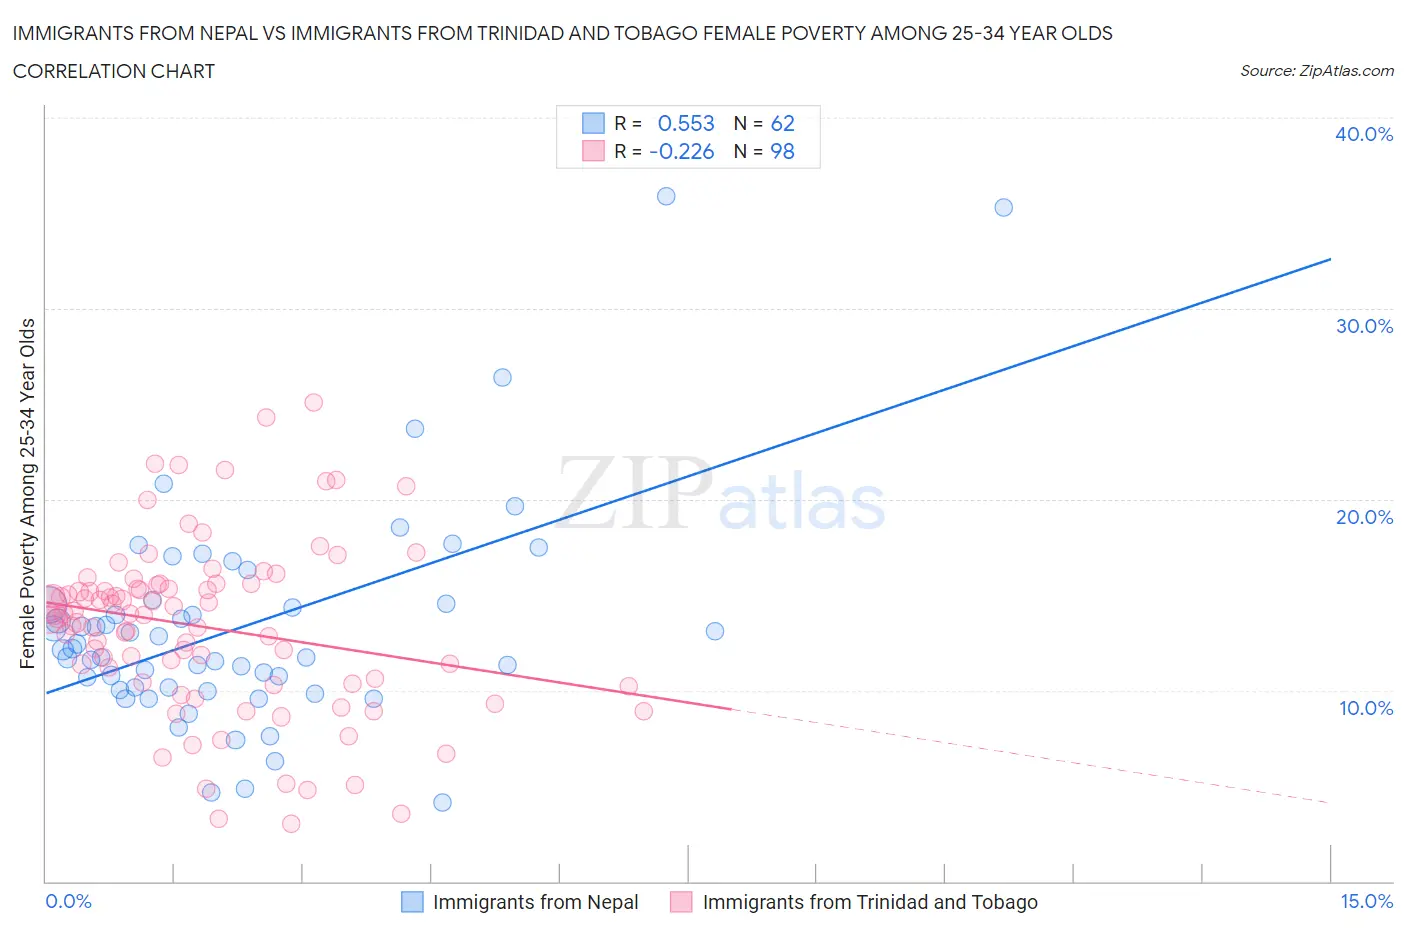
Immigrants from Nepal vs Immigrants from Trinidad and Tobago Female Poverty Among 25-34 Year Olds Correlation Chart
The statistical analysis conducted on geographies consisting of 185,514,428 people shows a substantial positive correlation between the proportion of Immigrants from Nepal and poverty level among females between the ages 25 and 34 in the United States with a correlation coefficient (R) of 0.553 and weighted average of 12.8%. Similarly, the statistical analysis conducted on geographies consisting of 221,230,630 people shows a weak negative correlation between the proportion of Immigrants from Trinidad and Tobago and poverty level among females between the ages 25 and 34 in the United States with a correlation coefficient (R) of -0.226 and weighted average of 14.0%, a difference of 9.1%.
Female Poverty Among 25-34 Year Olds Correlation Summary
| Measurement | Immigrants from Nepal | Immigrants from Trinidad and Tobago |
| Minimum | 4.2% | 3.0% |
| Maximum | 35.9% | 25.1% |
| Range | 31.7% | 22.1% |
| Mean | 13.4% | 13.3% |
| Median | 12.1% | 14.0% |
| Interquartile 25% (IQ1) | 10.1% | 10.4% |
| Interquartile 75% (IQ3) | 14.5% | 15.5% |
| Interquartile Range (IQR) | 4.4% | 5.1% |
| Standard Deviation (Sample) | 5.8% | 4.5% |
| Standard Deviation (Population) | 5.8% | 4.5% |
Similar Demographics by Female Poverty Among 25-34 Year Olds
Demographics Similar to Immigrants from Nepal by Female Poverty Among 25-34 Year Olds
In terms of female poverty among 25-34 year olds, the demographic groups most similar to Immigrants from Nepal are Carpatho Rusyn (12.8%, a difference of 0.0%), Mongolian (12.8%, a difference of 0.010%), Immigrants from Kuwait (12.8%, a difference of 0.020%), Romanian (12.8%, a difference of 0.070%), and Chilean (12.8%, a difference of 0.080%).
| Demographics | Rating | Rank | Female Poverty Among 25-34 Year Olds |
| Immigrants | Morocco | 93.9 /100 | #112 | Exceptional 12.8% |
| Immigrants | Syria | 93.8 /100 | #113 | Exceptional 12.8% |
| Immigrants | Southern Europe | 93.6 /100 | #114 | Exceptional 12.8% |
| Immigrants | Brazil | 93.3 /100 | #115 | Exceptional 12.8% |
| Chileans | 93.2 /100 | #116 | Exceptional 12.8% |
| Immigrants | Kuwait | 93.1 /100 | #117 | Exceptional 12.8% |
| Mongolians | 93.0 /100 | #118 | Exceptional 12.8% |
| Immigrants | Nepal | 93.0 /100 | #119 | Exceptional 12.8% |
| Carpatho Rusyns | 93.0 /100 | #120 | Exceptional 12.8% |
| Romanians | 92.8 /100 | #121 | Exceptional 12.8% |
| Immigrants | Western Asia | 92.7 /100 | #122 | Exceptional 12.8% |
| Slovenes | 92.7 /100 | #123 | Exceptional 12.8% |
| Immigrants | Netherlands | 92.0 /100 | #124 | Exceptional 12.8% |
| Immigrants | Canada | 91.5 /100 | #125 | Exceptional 12.9% |
| Immigrants | Fiji | 91.2 /100 | #126 | Exceptional 12.9% |
Demographics Similar to Immigrants from Trinidad and Tobago by Female Poverty Among 25-34 Year Olds
In terms of female poverty among 25-34 year olds, the demographic groups most similar to Immigrants from Trinidad and Tobago are Welsh (14.0%, a difference of 0.050%), Hmong (13.9%, a difference of 0.35%), English (13.9%, a difference of 0.37%), Immigrants from Germany (13.9%, a difference of 0.43%), and Immigrants (14.0%, a difference of 0.46%).
| Demographics | Rating | Rank | Female Poverty Among 25-34 Year Olds |
| Moroccans | 25.1 /100 | #194 | Fair 13.8% |
| Immigrants | Cambodia | 24.0 /100 | #195 | Fair 13.9% |
| Scottish | 23.6 /100 | #196 | Fair 13.9% |
| Immigrants | Saudi Arabia | 21.9 /100 | #197 | Fair 13.9% |
| Immigrants | Germany | 20.9 /100 | #198 | Fair 13.9% |
| English | 20.4 /100 | #199 | Fair 13.9% |
| Hmong | 20.3 /100 | #200 | Fair 13.9% |
| Immigrants | Trinidad and Tobago | 17.6 /100 | #201 | Poor 14.0% |
| Welsh | 17.2 /100 | #202 | Poor 14.0% |
| Immigrants | Immigrants | 14.5 /100 | #203 | Poor 14.0% |
| Hawaiians | 13.6 /100 | #204 | Poor 14.1% |
| Immigrants | Africa | 13.4 /100 | #205 | Poor 14.1% |
| Hungarians | 11.8 /100 | #206 | Poor 14.1% |
| Japanese | 11.7 /100 | #207 | Poor 14.1% |
| Immigrants | Panama | 11.6 /100 | #208 | Poor 14.1% |