Immigrants from Lebanon vs Aleut Single Female Poverty
COMPARE
Immigrants from Lebanon
Aleut
Single Female Poverty
Single Female Poverty Comparison
Immigrants from Lebanon
Aleuts
19.6%
SINGLE FEMALE POVERTY
98.8/ 100
METRIC RATING
90th/ 347
METRIC RANK
25.4%
SINGLE FEMALE POVERTY
0.0/ 100
METRIC RATING
308th/ 347
METRIC RANK
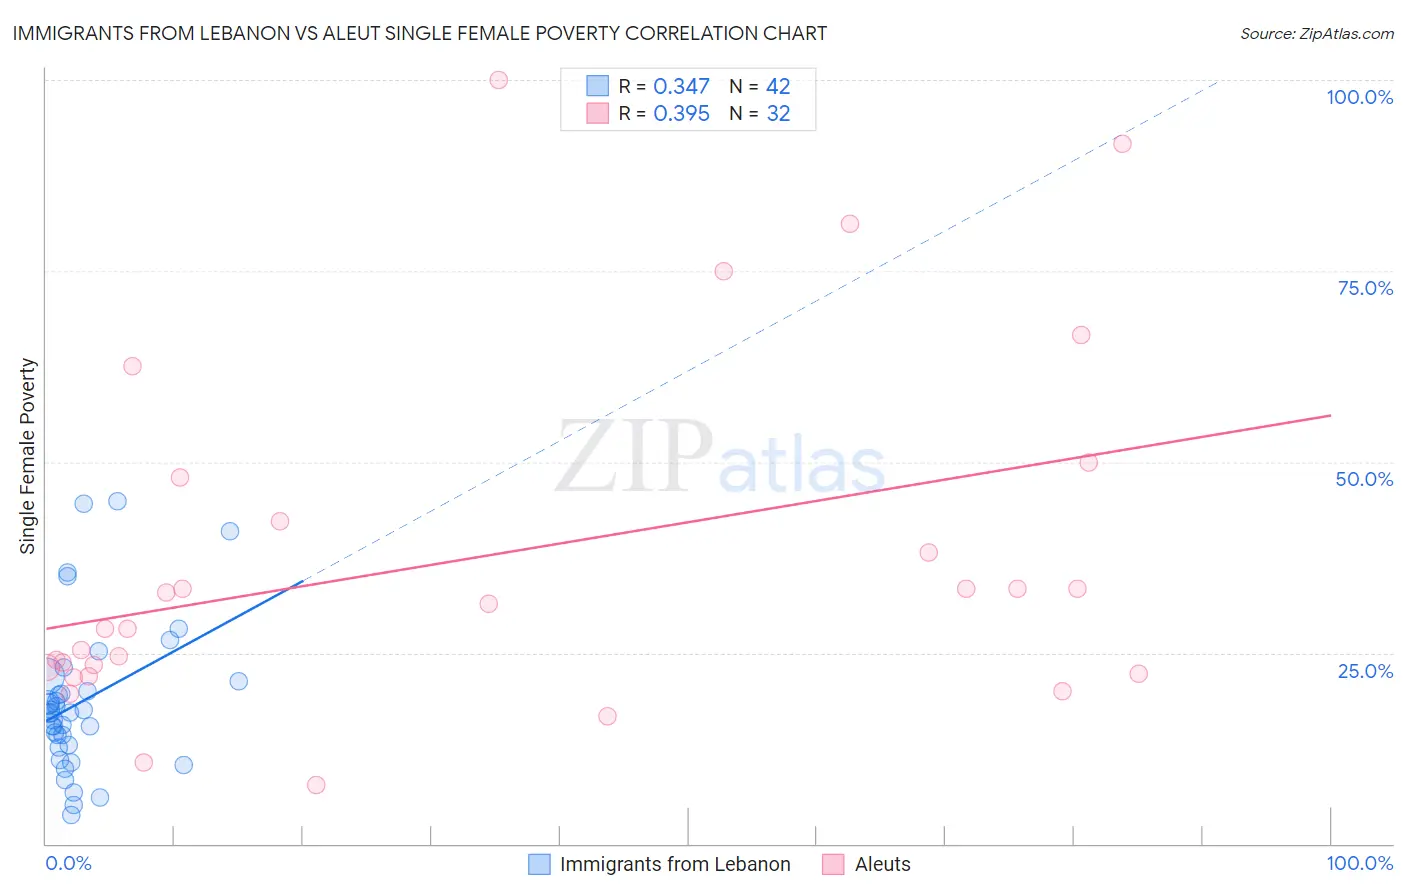
Immigrants from Lebanon vs Aleut Single Female Poverty Correlation Chart
The statistical analysis conducted on geographies consisting of 214,985,919 people shows a mild positive correlation between the proportion of Immigrants from Lebanon and poverty level among single females in the United States with a correlation coefficient (R) of 0.347 and weighted average of 19.6%. Similarly, the statistical analysis conducted on geographies consisting of 61,521,342 people shows a mild positive correlation between the proportion of Aleuts and poverty level among single females in the United States with a correlation coefficient (R) of 0.395 and weighted average of 25.4%, a difference of 30.0%.
Single Female Poverty Correlation Summary
| Measurement | Immigrants from Lebanon | Aleut |
| Minimum | 3.8% | 7.7% |
| Maximum | 44.8% | 100.0% |
| Range | 41.0% | 92.3% |
| Mean | 18.7% | 37.3% |
| Median | 17.2% | 29.8% |
| Interquartile 25% (IQ1) | 13.0% | 22.7% |
| Interquartile 75% (IQ3) | 21.3% | 45.1% |
| Interquartile Range (IQR) | 8.3% | 22.4% |
| Standard Deviation (Sample) | 9.8% | 23.2% |
| Standard Deviation (Population) | 9.6% | 22.8% |
Similar Demographics by Single Female Poverty
Demographics Similar to Immigrants from Lebanon by Single Female Poverty
In terms of single female poverty, the demographic groups most similar to Immigrants from Lebanon are Soviet Union (19.6%, a difference of 0.060%), Italian (19.6%, a difference of 0.11%), Immigrants from Austria (19.6%, a difference of 0.12%), Immigrants from Ukraine (19.5%, a difference of 0.17%), and Afghan (19.5%, a difference of 0.19%).
| Demographics | Rating | Rank | Single Female Poverty |
| Taiwanese | 99.2 /100 | #83 | Exceptional 19.4% |
| Immigrants | Sweden | 99.2 /100 | #84 | Exceptional 19.4% |
| Immigrants | Albania | 99.2 /100 | #85 | Exceptional 19.4% |
| Greeks | 99.2 /100 | #86 | Exceptional 19.4% |
| Zimbabweans | 99.0 /100 | #87 | Exceptional 19.5% |
| Afghans | 99.0 /100 | #88 | Exceptional 19.5% |
| Immigrants | Ukraine | 99.0 /100 | #89 | Exceptional 19.5% |
| Immigrants | Lebanon | 98.8 /100 | #90 | Exceptional 19.6% |
| Soviet Union | 98.8 /100 | #91 | Exceptional 19.6% |
| Italians | 98.8 /100 | #92 | Exceptional 19.6% |
| Immigrants | Austria | 98.8 /100 | #93 | Exceptional 19.6% |
| Romanians | 98.6 /100 | #94 | Exceptional 19.6% |
| Estonians | 98.2 /100 | #95 | Exceptional 19.7% |
| Immigrants | Brazil | 98.2 /100 | #96 | Exceptional 19.7% |
| Croatians | 98.1 /100 | #97 | Exceptional 19.7% |
Demographics Similar to Aleuts by Single Female Poverty
In terms of single female poverty, the demographic groups most similar to Aleuts are Dominican (25.4%, a difference of 0.010%), Central American Indian (25.5%, a difference of 0.16%), Potawatomi (25.4%, a difference of 0.17%), Immigrants from Mexico (25.3%, a difference of 0.39%), and Immigrants from Honduras (25.5%, a difference of 0.44%).
| Demographics | Rating | Rank | Single Female Poverty |
| Hondurans | 0.0 /100 | #301 | Tragic 25.1% |
| Shoshone | 0.0 /100 | #302 | Tragic 25.1% |
| Somalis | 0.0 /100 | #303 | Tragic 25.2% |
| Immigrants | Congo | 0.0 /100 | #304 | Tragic 25.3% |
| Immigrants | Dominican Republic | 0.0 /100 | #305 | Tragic 25.3% |
| Immigrants | Mexico | 0.0 /100 | #306 | Tragic 25.3% |
| Potawatomi | 0.0 /100 | #307 | Tragic 25.4% |
| Aleuts | 0.0 /100 | #308 | Tragic 25.4% |
| Dominicans | 0.0 /100 | #309 | Tragic 25.4% |
| Central American Indians | 0.0 /100 | #310 | Tragic 25.5% |
| Immigrants | Honduras | 0.0 /100 | #311 | Tragic 25.5% |
| Paiute | 0.0 /100 | #312 | Tragic 25.5% |
| Comanche | 0.0 /100 | #313 | Tragic 25.6% |
| Cherokee | 0.0 /100 | #314 | Tragic 25.7% |
| Iroquois | 0.0 /100 | #315 | Tragic 25.7% |