Immigrants from Lebanon vs Immigrants from Haiti Single Female Poverty

COMPARE

Immigrants from Lebanon
Race
Ancestry
AfghanAfricanAlaska NativeAlaskan AthabascanAlbanianAleutAlsatianAmericanApacheArabArapahoArgentineanArmenianAssyrian/Chaldean/SyriacAustralianAustrianBahamianBangladeshiBarbadianBasqueBelgianBelizeanBermudanBhutaneseBlackfeetBolivianBrazilianBritishBritish West IndianBulgarianBurmeseCajunCambodianCanadianCape VerdeanCarpatho RusynCelticCentral AmericanCentral American IndianCherokeeCheyenneChickasawChileanChineseChippewaChoctawColombianColvilleComancheCosta RicanCreeCreekCroatianCrowCubanCypriotCzechCzechoslovakianDanishDelawareDominicanDutchDutch West IndianEastern EuropeanEcuadorianEgyptianEnglishEstonianEthiopianEuropeanFijianFilipinoFinnishFrenchFrench American IndianFrench CanadianGermanGerman RussianGhanaianGreekGuamanian/ChamorroGuatemalanGuyaneseHaitianHmongHonduranHopiHoumaHungarianIcelanderIndian (Asian)IndonesianInupiatIranianIraqiIrishIroquoisIsraeliItalianJamaicanJapaneseJordanianKenyanKiowaKoreanLaotianLatvianLebaneseLiberianLithuanianLumbeeLuxembourgerMacedonianMalaysianMalteseMarshalleseMenomineeMexicanMexican American IndianMongolianMoroccanNative HawaiianNavajoNepaleseNew ZealanderNicaraguanNigerianNorthern EuropeanNorwegianOkinawanOsageOttawaPaiutePakistaniPalestinianPanamanianParaguayanPennsylvania GermanPeruvianPimaPolishPortuguesePotawatomiPuebloPuerto RicanPuget Sound SalishRomanianRussianSalvadoranSamoanScandinavianScotch-IrishScottishSeminoleSenegaleseSerbianShoshoneSierra LeoneanSiouxSlavicSlovakSloveneSomaliSouth AfricanSouth AmericanSouth American IndianSoviet UnionSpaniardSpanishSpanish AmericanSpanish American IndianSri LankanSubsaharan AfricanSudaneseSwedishSwissSyrianTaiwaneseThaiTlingit-HaidaTohono O'OdhamTonganTrinidadian and TobagonianTsimshianTurkishU.S. Virgin IslanderUgandanUkrainianUruguayanUteVenezuelanVietnameseWelshWest IndianYakamaYaquiYugoslavianYumanYup'ikZimbabwean
Immigration
NonimmigrantsImmigrantsAfghanistanAfricaAlbaniaArgentinaArmeniaAsiaAustraliaAustriaBahamasBangladeshBarbadosBelarusBelgiumBelizeBoliviaBosnia and HerzegovinaBrazilBulgariaBurma/MyanmarCabo VerdeCambodiaCameroonCanadaCaribbeanCentral AmericaChileChinaColombiaCongoCosta RicaCroatiaCubaCzechoslovakiaDenmarkDominicaDominican RepublicEastern AfricaEastern AsiaEastern EuropeEcuadorEgyptEl SalvadorEnglandEritreaEthiopiaEuropeFijiFranceGermanyGhanaGreeceGrenadaGuatemalaGuyanaHondurasHong KongHungaryIndiaIndonesiaIranIraqIrelandIsraelItalyJamaicaJapanJordanKazakhstanKenyaKoreaKuwaitLaosLatin AmericaLatviaLebanonLiberiaLithuaniaMalaysiaMexicoMicronesiaMiddle AfricaMoldovaMoroccoNepalNetherlandsNicaraguaNigeriaNorth AmericaNorth MacedoniaNorthern AfricaNorthern EuropeNorwayOceaniaPakistanPanamaPeruPhilippinesPolandPortugalRomaniaRussiaSaudi ArabiaScotlandSenegalSerbiaSierra LeoneSingaporeSomaliaSouth AfricaSouth AmericaSouth Central AsiaSouth Eastern AsiaSouthern EuropeSpainSri LankaSt. Vincent and the GrenadinesSudanSwedenSwitzerlandSyriaTaiwanThailandTrinidad and TobagoTurkeyUgandaUkraineUruguayUzbekistanVenezuelaVietnamWest IndiesWestern AfricaWestern AsiaWestern EuropeYemenZaireZimbabweAzores
Immigrants from Haiti
Race
Ancestry
AfghanAfricanAlaska NativeAlaskan AthabascanAlbanianAleutAlsatianAmericanApacheArabArapahoArgentineanArmenianAssyrian/Chaldean/SyriacAustralianAustrianBahamianBangladeshiBarbadianBasqueBelgianBelizeanBermudanBhutaneseBlackfeetBolivianBrazilianBritishBritish West IndianBulgarianBurmeseCajunCambodianCanadianCape VerdeanCarpatho RusynCelticCentral AmericanCentral American IndianCherokeeCheyenneChickasawChileanChineseChippewaChoctawColombianColvilleComancheCosta RicanCreeCreekCroatianCrowCubanCypriotCzechCzechoslovakianDanishDelawareDominicanDutchDutch West IndianEastern EuropeanEcuadorianEgyptianEnglishEstonianEthiopianEuropeanFijianFilipinoFinnishFrenchFrench American IndianFrench CanadianGermanGerman RussianGhanaianGreekGuamanian/ChamorroGuatemalanGuyaneseHaitianHmongHonduranHopiHoumaHungarianIcelanderIndian (Asian)IndonesianInupiatIranianIraqiIrishIroquoisIsraeliItalianJamaicanJapaneseJordanianKenyanKiowaKoreanLaotianLatvianLebaneseLiberianLithuanianLumbeeLuxembourgerMacedonianMalaysianMalteseMarshalleseMenomineeMexicanMexican American IndianMongolianMoroccanNative HawaiianNavajoNepaleseNew ZealanderNicaraguanNigerianNorthern EuropeanNorwegianOkinawanOsageOttawaPaiutePakistaniPalestinianPanamanianParaguayanPennsylvania GermanPeruvianPimaPolishPortuguesePotawatomiPuebloPuerto RicanPuget Sound SalishRomanianRussianSalvadoranSamoanScandinavianScotch-IrishScottishSeminoleSenegaleseSerbianShoshoneSierra LeoneanSiouxSlavicSlovakSloveneSomaliSouth AfricanSouth AmericanSouth American IndianSoviet UnionSpaniardSpanishSpanish AmericanSpanish American IndianSri LankanSubsaharan AfricanSudaneseSwedishSwissSyrianTaiwaneseThaiTlingit-HaidaTohono O'OdhamTonganTrinidadian and TobagonianTsimshianTurkishU.S. Virgin IslanderUgandanUkrainianUruguayanUteVenezuelanVietnameseWelshWest IndianYakamaYaquiYugoslavianYumanYup'ikZimbabwean
Immigration
NonimmigrantsImmigrantsAfghanistanAfricaAlbaniaArgentinaArmeniaAsiaAustraliaAustriaBahamasBangladeshBarbadosBelarusBelgiumBelizeBoliviaBosnia and HerzegovinaBrazilBulgariaBurma/MyanmarCabo VerdeCambodiaCameroonCanadaCaribbeanCentral AmericaChileChinaColombiaCongoCosta RicaCroatiaCubaCzechoslovakiaDenmarkDominicaDominican RepublicEastern AfricaEastern AsiaEastern EuropeEcuadorEgyptEl SalvadorEnglandEritreaEthiopiaEuropeFijiFranceGermanyGhanaGreeceGrenadaGuatemalaGuyanaHaitiHondurasHong KongHungaryIndiaIndonesiaIranIraqIrelandIsraelItalyJamaicaJapanJordanKazakhstanKenyaKoreaKuwaitLaosLatin AmericaLatviaLiberiaLithuaniaMalaysiaMexicoMicronesiaMiddle AfricaMoldovaMoroccoNepalNetherlandsNicaraguaNigeriaNorth AmericaNorth MacedoniaNorthern AfricaNorthern EuropeNorwayOceaniaPakistanPanamaPeruPhilippinesPolandPortugalRomaniaRussiaSaudi ArabiaScotlandSenegalSerbiaSierra LeoneSingaporeSomaliaSouth AfricaSouth AmericaSouth Central AsiaSouth Eastern AsiaSouthern EuropeSpainSri LankaSt. Vincent and the GrenadinesSudanSwedenSwitzerlandSyriaTaiwanThailandTrinidad and TobagoTurkeyUgandaUkraineUruguayUzbekistanVenezuelaVietnamWest IndiesWestern AfricaWestern AsiaWestern EuropeYemenZaireZimbabweAzores
Single Female Poverty
Income
Poverty
Unemployment
Labor Participation
Family Structure
Vehicle Availability
Education Level
Disability

Single Female Poverty Comparison

Immigrants from Lebanon

Immigrants from Haiti

Exceptional
Poor
19.6%
SINGLE FEMALE POVERTY
98.8/ 100
METRIC RATING
90th/ 347
METRIC RANK
21.5%
SINGLE FEMALE POVERTY
18.8/ 100
METRIC RATING
203rd/ 347
METRIC RANK

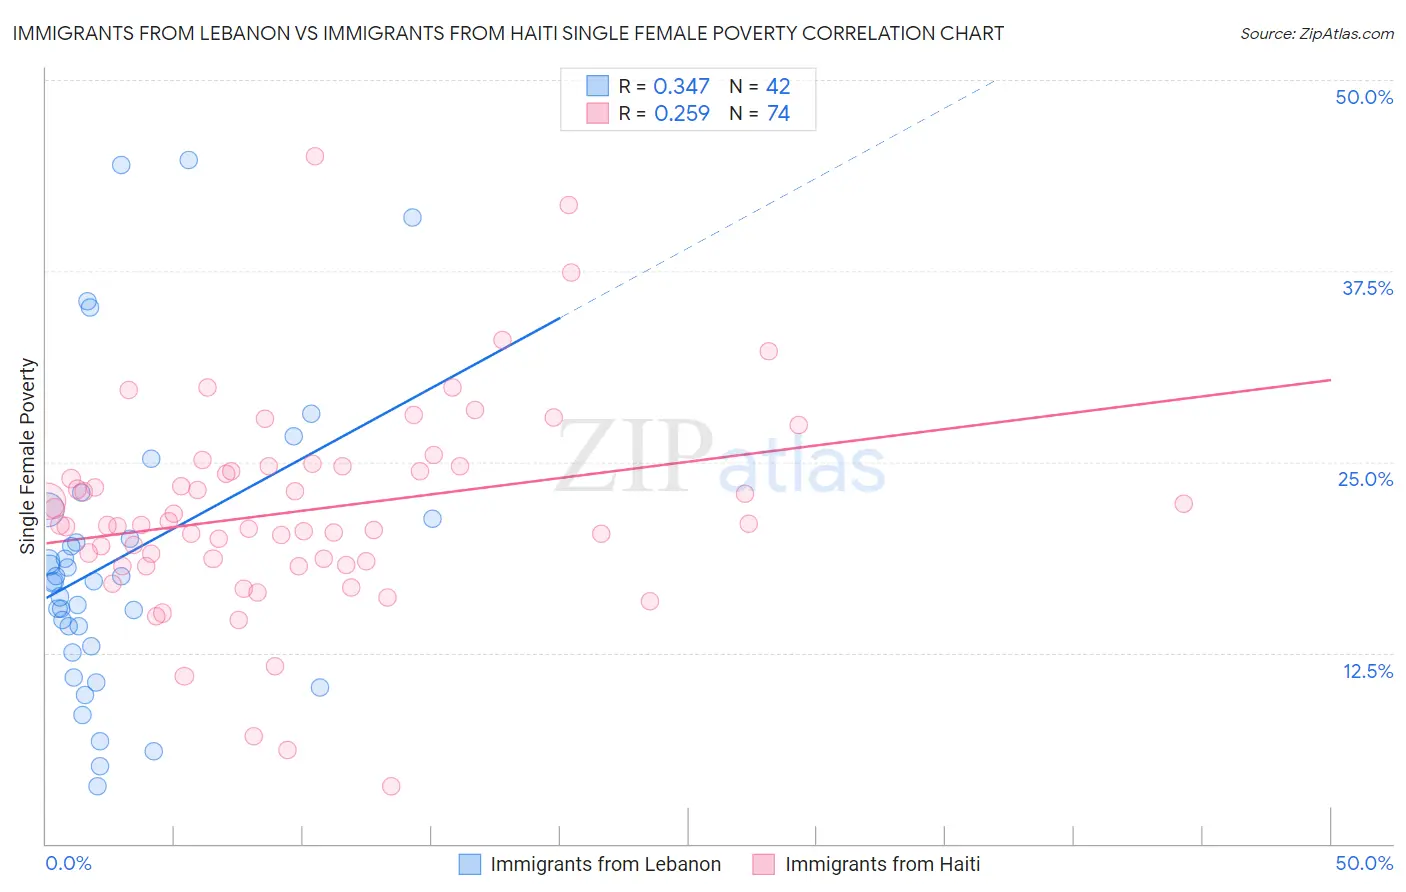
Immigrants from Lebanon vs Immigrants from Haiti Single Female Poverty Correlation Chart

The statistical analysis conducted on geographies consisting of 214,985,919 people shows a mild positive correlation between the proportion of Immigrants from Lebanon and poverty level among single females in the United States with a correlation coefficient (R) of 0.347 and weighted average of 19.6%. Similarly, the statistical analysis conducted on geographies consisting of 223,147,681 people shows a weak positive correlation between the proportion of Immigrants from Haiti and poverty level among single females in the United States with a correlation coefficient (R) of 0.259 and weighted average of 21.5%, a difference of 9.9%.
Immigrants from Lebanon vs Immigrants from Haiti Single Female Poverty

Single Female Poverty Correlation Summary

MeasurementImmigrants from LebanonImmigrants from Haiti
Minimum3.8%3.7%
Maximum44.8%45.0%
Range41.0%41.2%
Mean18.7%21.8%
Median17.2%20.9%
Interquartile 25% (IQ1)13.0%18.5%
Interquartile 75% (IQ3)21.3%24.7%
Interquartile Range (IQR)8.3%6.2%
Standard Deviation (Sample)9.8%6.8%
Standard Deviation (Population)9.6%6.7%

Similar Demographics by Single Female Poverty

Demographics Similar to Immigrants from Lebanon by Single Female Poverty

In terms of single female poverty, the demographic groups most similar to Immigrants from Lebanon are Soviet Union (19.6%, a difference of 0.060%), Italian (19.6%, a difference of 0.11%), Immigrants from Austria (19.6%, a difference of 0.12%), Immigrants from Ukraine (19.5%, a difference of 0.17%), and Afghan (19.5%, a difference of 0.19%).
DemographicsRating | RankSingle Female Poverty
Taiwanese
99.2
/100
|
#83
Exceptional
19.4%
Immigrants | Sweden
99.2
/100
|
#84
Exceptional
19.4%
Immigrants | Albania
99.2
/100
|
#85
Exceptional
19.4%
Greeks
99.2
/100
|
#86
Exceptional
19.4%
Zimbabweans
99.0
/100
|
#87
Exceptional
19.5%
Afghans
99.0
/100
|
#88
Exceptional
19.5%
Immigrants | Ukraine
99.0
/100
|
#89
Exceptional
19.5%
Immigrants | Lebanon
98.8
/100
|
#90
Exceptional
19.6%
Soviet Union
98.8
/100
|
#91
Exceptional
19.6%
Italians
98.8
/100
|
#92
Exceptional
19.6%
Immigrants | Austria
98.8
/100
|
#93
Exceptional
19.6%
Romanians
98.6
/100
|
#94
Exceptional
19.6%
Estonians
98.2
/100
|
#95
Exceptional
19.7%
Immigrants | Brazil
98.2
/100
|
#96
Exceptional
19.7%
Croatians
98.1
/100
|
#97
Exceptional
19.7%

Demographics Similar to Immigrants from Haiti by Single Female Poverty

In terms of single female poverty, the demographic groups most similar to Immigrants from Haiti are Immigrants from Kenya (21.4%, a difference of 0.18%), Nigerian (21.4%, a difference of 0.20%), Immigrants from Africa (21.5%, a difference of 0.21%), Irish (21.4%, a difference of 0.25%), and Finnish (21.5%, a difference of 0.27%).
DemographicsRating | RankSingle Female Poverty
Immigrants | Saudi Arabia
27.1
/100
|
#196
Fair
21.3%
Japanese
26.4
/100
|
#197
Fair
21.3%
Swiss
24.2
/100
|
#198
Fair
21.4%
Immigrants | Immigrants
22.0
/100
|
#199
Fair
21.4%
Irish
21.4
/100
|
#200
Fair
21.4%
Nigerians
20.9
/100
|
#201
Fair
21.4%
Immigrants | Kenya
20.7
/100
|
#202
Fair
21.4%
Immigrants | Haiti
18.8
/100
|
#203
Poor
21.5%
Immigrants | Africa
16.7
/100
|
#204
Poor
21.5%
Finns
16.2
/100
|
#205
Poor
21.5%
Belgians
16.1
/100
|
#206
Poor
21.5%
Ghanaians
15.7
/100
|
#207
Poor
21.6%
Haitians
15.4
/100
|
#208
Poor
21.6%
Immigrants | Eastern Africa
15.1
/100
|
#209
Poor
21.6%
Immigrants | Panama
14.4
/100
|
#210
Poor
21.6%