Immigrants from Lebanon vs Barbadian Single Female Poverty
COMPARE
Immigrants from Lebanon
Barbadian
Single Female Poverty
Single Female Poverty Comparison
Immigrants from Lebanon
Barbadians
19.6%
SINGLE FEMALE POVERTY
98.8/ 100
METRIC RATING
90th/ 347
METRIC RANK
21.8%
SINGLE FEMALE POVERTY
7.2/ 100
METRIC RATING
224th/ 347
METRIC RANK
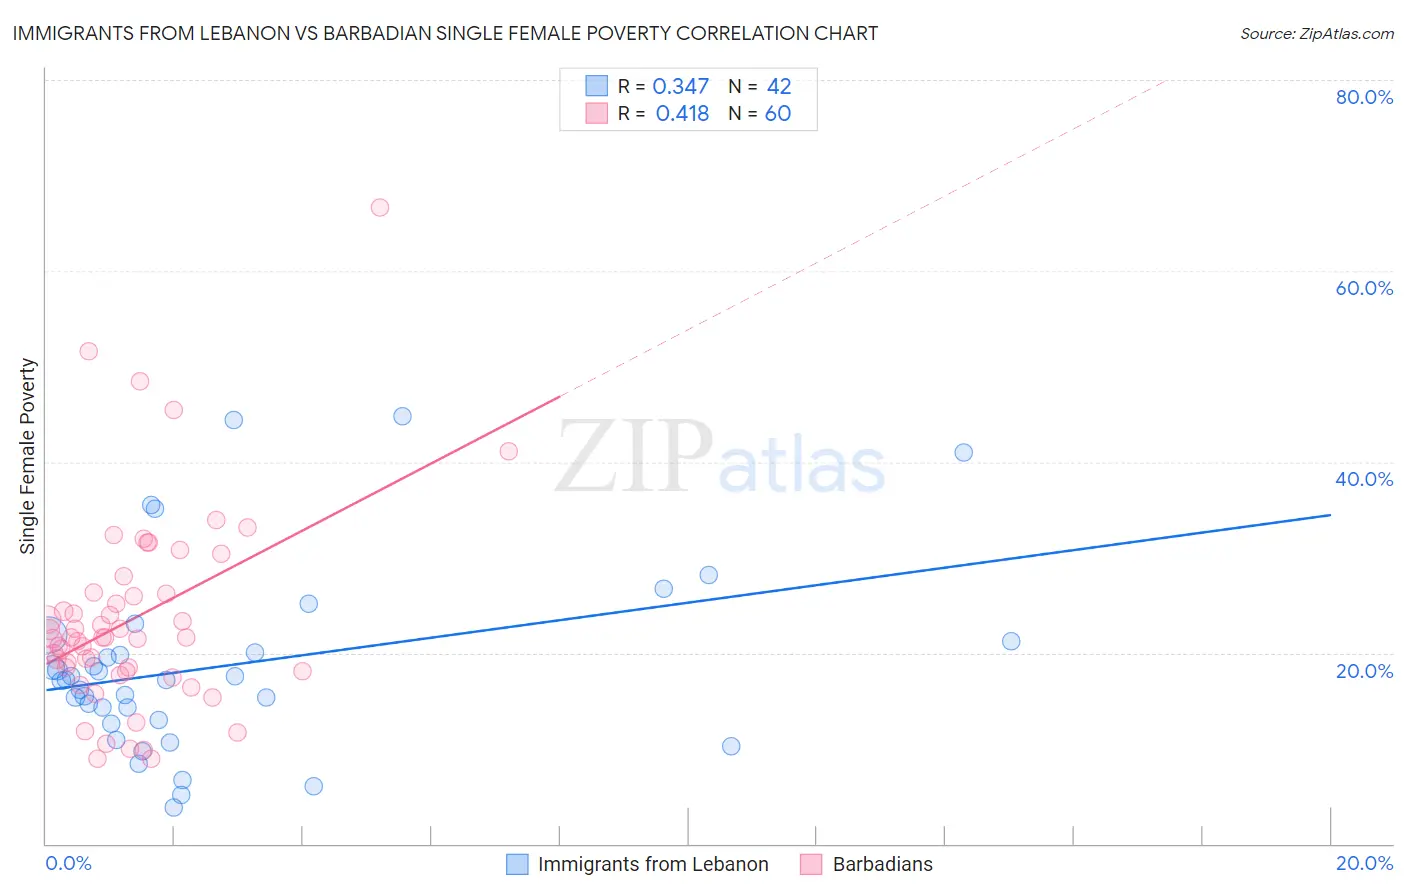
Immigrants from Lebanon vs Barbadian Single Female Poverty Correlation Chart
The statistical analysis conducted on geographies consisting of 214,985,919 people shows a mild positive correlation between the proportion of Immigrants from Lebanon and poverty level among single females in the United States with a correlation coefficient (R) of 0.347 and weighted average of 19.6%. Similarly, the statistical analysis conducted on geographies consisting of 140,678,915 people shows a moderate positive correlation between the proportion of Barbadians and poverty level among single females in the United States with a correlation coefficient (R) of 0.418 and weighted average of 21.8%, a difference of 11.7%.
Single Female Poverty Correlation Summary
| Measurement | Immigrants from Lebanon | Barbadian |
| Minimum | 3.8% | 8.9% |
| Maximum | 44.8% | 66.7% |
| Range | 41.0% | 57.8% |
| Mean | 18.7% | 23.6% |
| Median | 17.2% | 21.6% |
| Interquartile 25% (IQ1) | 13.0% | 18.1% |
| Interquartile 75% (IQ3) | 21.3% | 26.3% |
| Interquartile Range (IQR) | 8.3% | 8.1% |
| Standard Deviation (Sample) | 9.8% | 10.6% |
| Standard Deviation (Population) | 9.6% | 10.5% |
Similar Demographics by Single Female Poverty
Demographics Similar to Immigrants from Lebanon by Single Female Poverty
In terms of single female poverty, the demographic groups most similar to Immigrants from Lebanon are Soviet Union (19.6%, a difference of 0.060%), Italian (19.6%, a difference of 0.11%), Immigrants from Austria (19.6%, a difference of 0.12%), Immigrants from Ukraine (19.5%, a difference of 0.17%), and Afghan (19.5%, a difference of 0.19%).
| Demographics | Rating | Rank | Single Female Poverty |
| Taiwanese | 99.2 /100 | #83 | Exceptional 19.4% |
| Immigrants | Sweden | 99.2 /100 | #84 | Exceptional 19.4% |
| Immigrants | Albania | 99.2 /100 | #85 | Exceptional 19.4% |
| Greeks | 99.2 /100 | #86 | Exceptional 19.4% |
| Zimbabweans | 99.0 /100 | #87 | Exceptional 19.5% |
| Afghans | 99.0 /100 | #88 | Exceptional 19.5% |
| Immigrants | Ukraine | 99.0 /100 | #89 | Exceptional 19.5% |
| Immigrants | Lebanon | 98.8 /100 | #90 | Exceptional 19.6% |
| Soviet Union | 98.8 /100 | #91 | Exceptional 19.6% |
| Italians | 98.8 /100 | #92 | Exceptional 19.6% |
| Immigrants | Austria | 98.8 /100 | #93 | Exceptional 19.6% |
| Romanians | 98.6 /100 | #94 | Exceptional 19.6% |
| Estonians | 98.2 /100 | #95 | Exceptional 19.7% |
| Immigrants | Brazil | 98.2 /100 | #96 | Exceptional 19.7% |
| Croatians | 98.1 /100 | #97 | Exceptional 19.7% |
Demographics Similar to Barbadians by Single Female Poverty
In terms of single female poverty, the demographic groups most similar to Barbadians are Scottish (21.8%, a difference of 0.020%), Immigrants from Eritrea (21.8%, a difference of 0.16%), Immigrants from Grenada (21.8%, a difference of 0.17%), English (21.9%, a difference of 0.18%), and German (21.8%, a difference of 0.23%).
| Demographics | Rating | Rank | Single Female Poverty |
| Immigrants | St. Vincent and the Grenadines | 11.7 /100 | #217 | Poor 21.7% |
| Nepalese | 9.7 /100 | #218 | Tragic 21.7% |
| Panamanians | 9.4 /100 | #219 | Tragic 21.7% |
| Germans | 8.3 /100 | #220 | Tragic 21.8% |
| Immigrants | Grenada | 8.0 /100 | #221 | Tragic 21.8% |
| Immigrants | Eritrea | 7.9 /100 | #222 | Tragic 21.8% |
| Scottish | 7.3 /100 | #223 | Tragic 21.8% |
| Barbadians | 7.2 /100 | #224 | Tragic 21.8% |
| English | 6.4 /100 | #225 | Tragic 21.9% |
| Immigrants | Portugal | 5.8 /100 | #226 | Tragic 21.9% |
| Immigrants | Ghana | 5.8 /100 | #227 | Tragic 21.9% |
| Salvadorans | 5.5 /100 | #228 | Tragic 21.9% |
| Tlingit-Haida | 5.4 /100 | #229 | Tragic 21.9% |
| Immigrants | Western Africa | 5.3 /100 | #230 | Tragic 22.0% |
| Welsh | 5.0 /100 | #231 | Tragic 22.0% |