Immigrants from Lebanon vs Aleut Median Female Earnings
COMPARE
Immigrants from Lebanon
Aleut
Median Female Earnings
Median Female Earnings Comparison
Immigrants from Lebanon
Aleuts
$41,183
MEDIAN FEMALE EARNINGS
95.6/ 100
METRIC RATING
118th/ 347
METRIC RANK
$38,719
MEDIAN FEMALE EARNINGS
11.6/ 100
METRIC RATING
211th/ 347
METRIC RANK
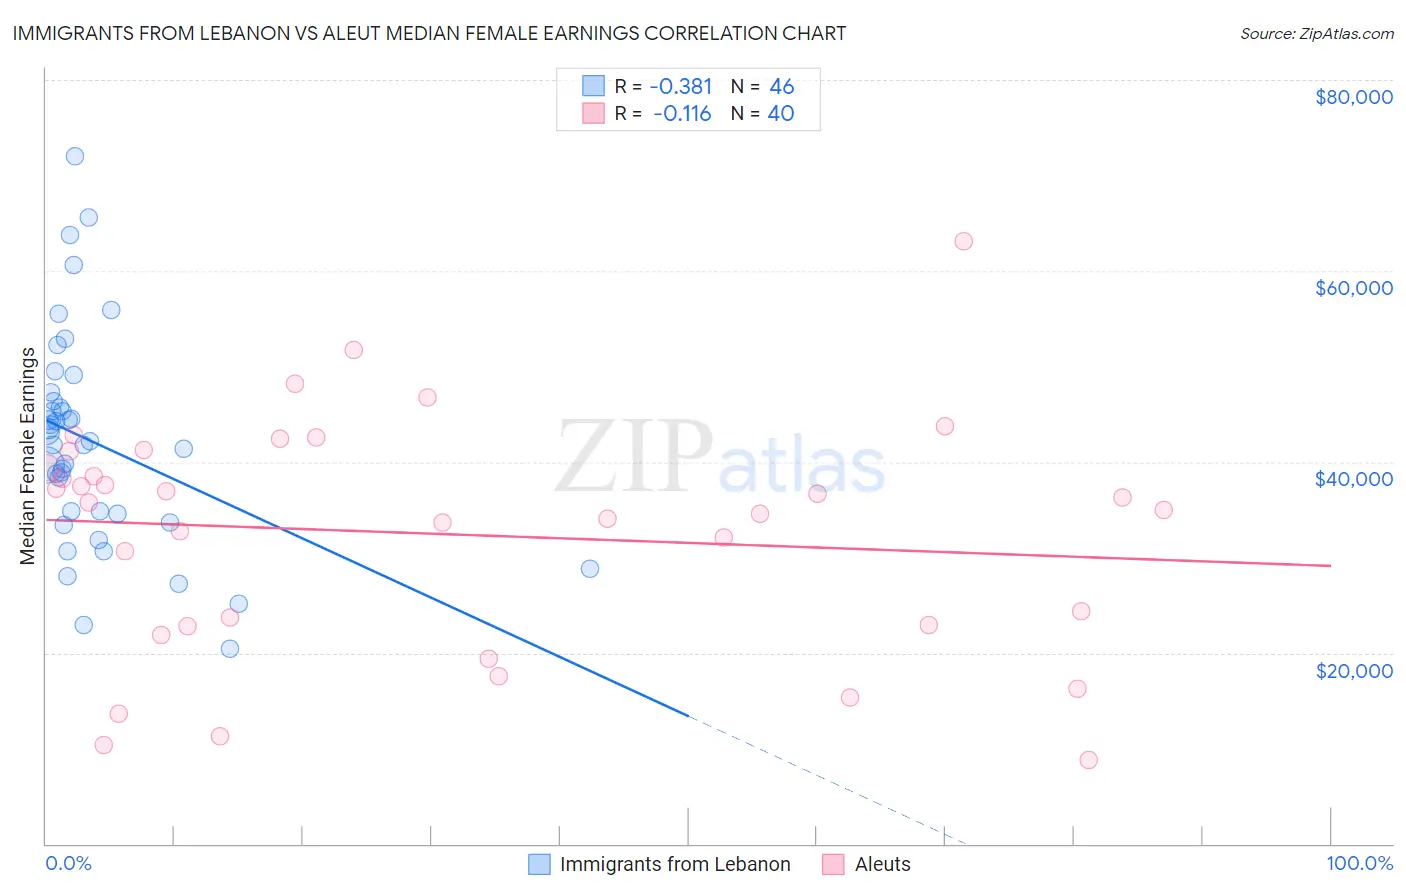
Immigrants from Lebanon vs Aleut Median Female Earnings Correlation Chart
The statistical analysis conducted on geographies consisting of 217,136,243 people shows a mild negative correlation between the proportion of Immigrants from Lebanon and median female earnings in the United States with a correlation coefficient (R) of -0.381 and weighted average of $41,183. Similarly, the statistical analysis conducted on geographies consisting of 61,761,178 people shows a poor negative correlation between the proportion of Aleuts and median female earnings in the United States with a correlation coefficient (R) of -0.116 and weighted average of $38,719, a difference of 6.4%.
Median Female Earnings Correlation Summary
| Measurement | Immigrants from Lebanon | Aleut |
| Minimum | $20,406 | $8,750 |
| Maximum | $72,000 | $63,125 |
| Range | $51,594 | $54,375 |
| Mean | $42,035 | $32,459 |
| Median | $41,983 | $35,345 |
| Interquartile 25% (IQ1) | $34,539 | $22,835 |
| Interquartile 75% (IQ3) | $46,364 | $40,258 |
| Interquartile Range (IQR) | $11,825 | $17,423 |
| Standard Deviation (Sample) | $11,071 | $12,271 |
| Standard Deviation (Population) | $10,950 | $12,117 |
Similar Demographics by Median Female Earnings
Demographics Similar to Immigrants from Lebanon by Median Female Earnings
In terms of median female earnings, the demographic groups most similar to Immigrants from Lebanon are Immigrants from Philippines ($41,114, a difference of 0.17%), Barbadian ($41,261, a difference of 0.19%), Immigrants from Brazil ($41,273, a difference of 0.22%), Immigrants from England ($41,277, a difference of 0.23%), and Korean ($41,276, a difference of 0.23%).
| Demographics | Rating | Rank | Median Female Earnings |
| Immigrants | Canada | 97.0 /100 | #111 | Exceptional $41,373 |
| Immigrants | North America | 96.7 /100 | #112 | Exceptional $41,319 |
| Macedonians | 96.4 /100 | #113 | Exceptional $41,286 |
| Immigrants | England | 96.4 /100 | #114 | Exceptional $41,277 |
| Koreans | 96.4 /100 | #115 | Exceptional $41,276 |
| Immigrants | Brazil | 96.4 /100 | #116 | Exceptional $41,273 |
| Barbadians | 96.3 /100 | #117 | Exceptional $41,261 |
| Immigrants | Lebanon | 95.6 /100 | #118 | Exceptional $41,183 |
| Immigrants | Philippines | 95.0 /100 | #119 | Exceptional $41,114 |
| Immigrants | Kuwait | 94.4 /100 | #120 | Exceptional $41,055 |
| Croatians | 93.7 /100 | #121 | Exceptional $40,993 |
| Immigrants | Jordan | 93.5 /100 | #122 | Exceptional $40,977 |
| Guyanese | 93.4 /100 | #123 | Exceptional $40,973 |
| Trinidadians and Tobagonians | 93.2 /100 | #124 | Exceptional $40,958 |
| Austrians | 92.7 /100 | #125 | Exceptional $40,923 |
Demographics Similar to Aleuts by Median Female Earnings
In terms of median female earnings, the demographic groups most similar to Aleuts are Guamanian/Chamorro ($38,717, a difference of 0.010%), Czechoslovakian ($38,738, a difference of 0.050%), Jamaican ($38,670, a difference of 0.13%), Iraqi ($38,666, a difference of 0.14%), and Spaniard ($38,656, a difference of 0.16%).
| Demographics | Rating | Rank | Median Female Earnings |
| Immigrants | Uruguay | 17.3 /100 | #204 | Poor $38,945 |
| Immigrants | Colombia | 16.3 /100 | #205 | Poor $38,913 |
| Immigrants | Bosnia and Herzegovina | 15.6 /100 | #206 | Poor $38,886 |
| Immigrants | Cambodia | 14.2 /100 | #207 | Poor $38,833 |
| Immigrants | Thailand | 13.6 /100 | #208 | Poor $38,810 |
| Norwegians | 13.4 /100 | #209 | Poor $38,802 |
| Czechoslovakians | 12.0 /100 | #210 | Poor $38,738 |
| Aleuts | 11.6 /100 | #211 | Poor $38,719 |
| Guamanians/Chamorros | 11.5 /100 | #212 | Poor $38,717 |
| Jamaicans | 10.5 /100 | #213 | Poor $38,670 |
| Iraqis | 10.5 /100 | #214 | Poor $38,666 |
| Spaniards | 10.3 /100 | #215 | Poor $38,656 |
| Immigrants | Ecuador | 10.1 /100 | #216 | Poor $38,644 |
| Immigrants | Jamaica | 9.7 /100 | #217 | Tragic $38,625 |
| Cape Verdeans | 9.5 /100 | #218 | Tragic $38,614 |