Immigrants from Uganda vs Aleut Single Female Poverty
COMPARE
Immigrants from Uganda
Aleut
Single Female Poverty
Single Female Poverty Comparison
Immigrants from Uganda
Aleuts
20.3%
SINGLE FEMALE POVERTY
89.1/ 100
METRIC RATING
142nd/ 347
METRIC RANK
25.4%
SINGLE FEMALE POVERTY
0.0/ 100
METRIC RATING
308th/ 347
METRIC RANK
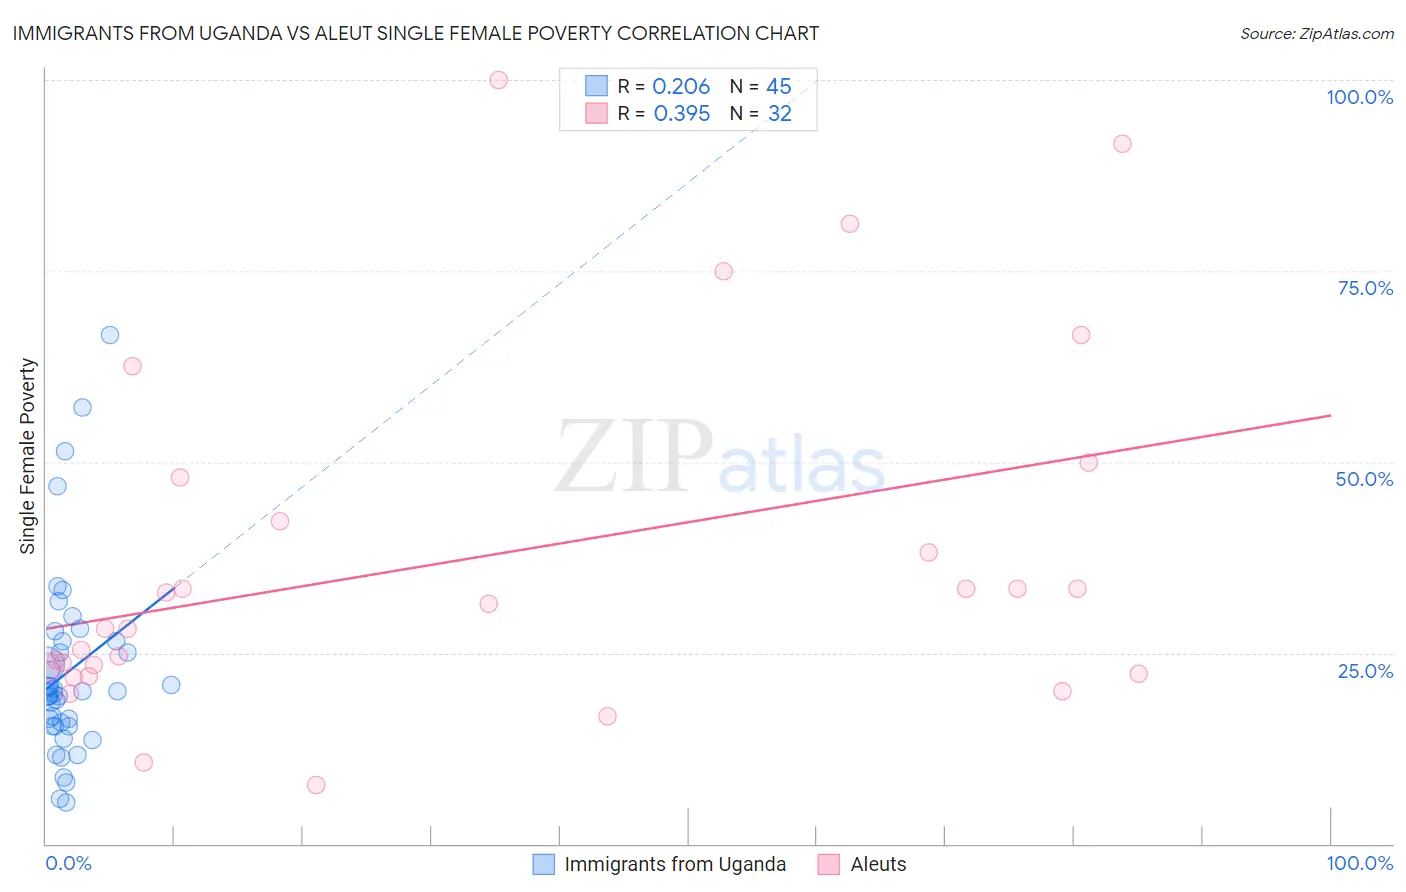
Immigrants from Uganda vs Aleut Single Female Poverty Correlation Chart
The statistical analysis conducted on geographies consisting of 125,509,533 people shows a weak positive correlation between the proportion of Immigrants from Uganda and poverty level among single females in the United States with a correlation coefficient (R) of 0.206 and weighted average of 20.3%. Similarly, the statistical analysis conducted on geographies consisting of 61,521,342 people shows a mild positive correlation between the proportion of Aleuts and poverty level among single females in the United States with a correlation coefficient (R) of 0.395 and weighted average of 25.4%, a difference of 25.1%.
Single Female Poverty Correlation Summary
| Measurement | Immigrants from Uganda | Aleut |
| Minimum | 5.5% | 7.7% |
| Maximum | 66.7% | 100.0% |
| Range | 61.2% | 92.3% |
| Mean | 22.5% | 37.3% |
| Median | 19.7% | 29.8% |
| Interquartile 25% (IQ1) | 15.4% | 22.7% |
| Interquartile 75% (IQ3) | 26.5% | 45.1% |
| Interquartile Range (IQR) | 11.1% | 22.4% |
| Standard Deviation (Sample) | 12.6% | 23.2% |
| Standard Deviation (Population) | 12.4% | 22.8% |
Similar Demographics by Single Female Poverty
Demographics Similar to Immigrants from Uganda by Single Female Poverty
In terms of single female poverty, the demographic groups most similar to Immigrants from Uganda are Immigrants from North America (20.3%, a difference of 0.080%), Australian (20.3%, a difference of 0.12%), Immigrants from Uzbekistan (20.3%, a difference of 0.13%), Immigrants from Kuwait (20.3%, a difference of 0.23%), and Syrian (20.3%, a difference of 0.23%).
| Demographics | Rating | Rank | Single Female Poverty |
| Immigrants | Iraq | 91.2 /100 | #135 | Exceptional 20.2% |
| Immigrants | Canada | 91.2 /100 | #136 | Exceptional 20.2% |
| Immigrants | Nepal | 90.6 /100 | #137 | Exceptional 20.3% |
| Slovenes | 90.5 /100 | #138 | Exceptional 20.3% |
| Immigrants | Kuwait | 90.4 /100 | #139 | Exceptional 20.3% |
| Syrians | 90.4 /100 | #140 | Exceptional 20.3% |
| Immigrants | North America | 89.5 /100 | #141 | Excellent 20.3% |
| Immigrants | Uganda | 89.1 /100 | #142 | Excellent 20.3% |
| Australians | 88.4 /100 | #143 | Excellent 20.3% |
| Immigrants | Uzbekistan | 88.3 /100 | #144 | Excellent 20.3% |
| Austrians | 85.8 /100 | #145 | Excellent 20.4% |
| Venezuelans | 85.5 /100 | #146 | Excellent 20.4% |
| South Africans | 85.3 /100 | #147 | Excellent 20.4% |
| Luxembourgers | 84.9 /100 | #148 | Excellent 20.4% |
| Portuguese | 81.5 /100 | #149 | Excellent 20.5% |
Demographics Similar to Aleuts by Single Female Poverty
In terms of single female poverty, the demographic groups most similar to Aleuts are Dominican (25.4%, a difference of 0.010%), Central American Indian (25.5%, a difference of 0.16%), Potawatomi (25.4%, a difference of 0.17%), Immigrants from Mexico (25.3%, a difference of 0.39%), and Immigrants from Honduras (25.5%, a difference of 0.44%).
| Demographics | Rating | Rank | Single Female Poverty |
| Hondurans | 0.0 /100 | #301 | Tragic 25.1% |
| Shoshone | 0.0 /100 | #302 | Tragic 25.1% |
| Somalis | 0.0 /100 | #303 | Tragic 25.2% |
| Immigrants | Congo | 0.0 /100 | #304 | Tragic 25.3% |
| Immigrants | Dominican Republic | 0.0 /100 | #305 | Tragic 25.3% |
| Immigrants | Mexico | 0.0 /100 | #306 | Tragic 25.3% |
| Potawatomi | 0.0 /100 | #307 | Tragic 25.4% |
| Aleuts | 0.0 /100 | #308 | Tragic 25.4% |
| Dominicans | 0.0 /100 | #309 | Tragic 25.4% |
| Central American Indians | 0.0 /100 | #310 | Tragic 25.5% |
| Immigrants | Honduras | 0.0 /100 | #311 | Tragic 25.5% |
| Paiute | 0.0 /100 | #312 | Tragic 25.5% |
| Comanche | 0.0 /100 | #313 | Tragic 25.6% |
| Cherokee | 0.0 /100 | #314 | Tragic 25.7% |
| Iroquois | 0.0 /100 | #315 | Tragic 25.7% |