Immigrants from Lebanon vs Aleut Single Father Households
COMPARE
Immigrants from Lebanon
Aleut
Single Father Households
Single Father Households Comparison
Immigrants from Lebanon
Aleuts
2.0%
SINGLE FATHER HOUSEHOLDS
100.0/ 100
METRIC RATING
46th/ 347
METRIC RANK
3.0%
SINGLE FATHER HOUSEHOLDS
0.0/ 100
METRIC RATING
326th/ 347
METRIC RANK
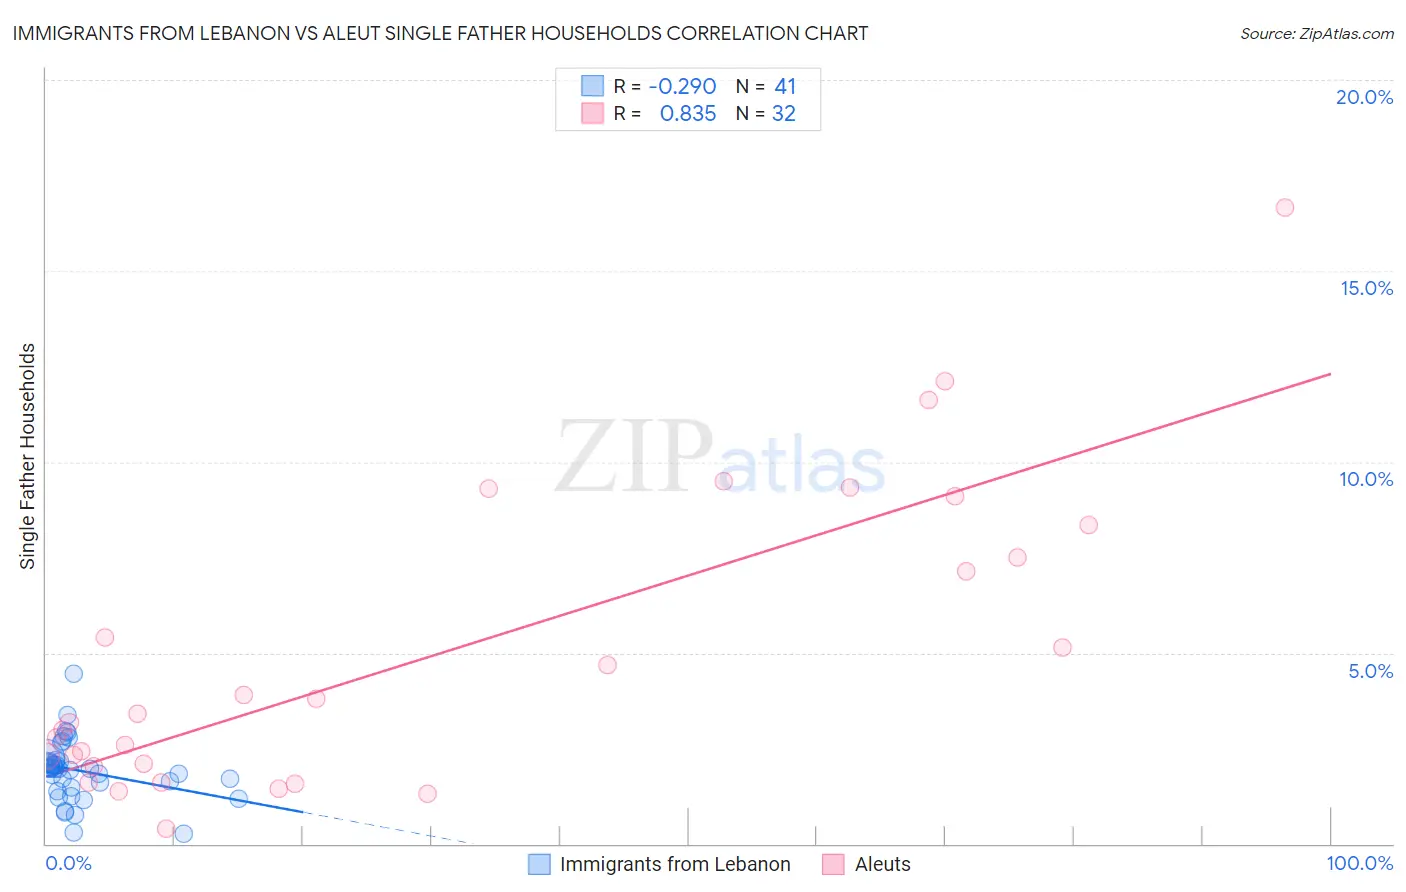
Immigrants from Lebanon vs Aleut Single Father Households Correlation Chart
The statistical analysis conducted on geographies consisting of 216,181,283 people shows a weak negative correlation between the proportion of Immigrants from Lebanon and percentage of single father households in the United States with a correlation coefficient (R) of -0.290 and weighted average of 2.0%. Similarly, the statistical analysis conducted on geographies consisting of 61,629,063 people shows a very strong positive correlation between the proportion of Aleuts and percentage of single father households in the United States with a correlation coefficient (R) of 0.835 and weighted average of 3.0%, a difference of 51.6%.
Single Father Households Correlation Summary
| Measurement | Immigrants from Lebanon | Aleut |
| Minimum | 0.25% | 0.40% |
| Maximum | 4.4% | 16.7% |
| Range | 4.2% | 16.3% |
| Mean | 1.9% | 5.0% |
| Median | 2.0% | 3.3% |
| Interquartile 25% (IQ1) | 1.4% | 2.1% |
| Interquartile 75% (IQ3) | 2.2% | 7.9% |
| Interquartile Range (IQR) | 0.76% | 5.8% |
| Standard Deviation (Sample) | 0.80% | 4.0% |
| Standard Deviation (Population) | 0.79% | 3.9% |
Similar Demographics by Single Father Households
Demographics Similar to Immigrants from Lebanon by Single Father Households
In terms of single father households, the demographic groups most similar to Immigrants from Lebanon are Russian (2.0%, a difference of 0.10%), Latvian (2.0%, a difference of 0.12%), Immigrants from Grenada (2.0%, a difference of 0.21%), Immigrants from Ukraine (2.0%, a difference of 0.35%), and Immigrants from Kazakhstan (2.0%, a difference of 0.37%).
| Demographics | Rating | Rank | Single Father Households |
| Immigrants | Sri Lanka | 100.0 /100 | #39 | Exceptional 2.0% |
| Immigrants | Bulgaria | 100.0 /100 | #40 | Exceptional 2.0% |
| Immigrants | Turkey | 100.0 /100 | #41 | Exceptional 2.0% |
| Macedonians | 100.0 /100 | #42 | Exceptional 2.0% |
| Immigrants | Grenada | 100.0 /100 | #43 | Exceptional 2.0% |
| Latvians | 100.0 /100 | #44 | Exceptional 2.0% |
| Russians | 100.0 /100 | #45 | Exceptional 2.0% |
| Immigrants | Lebanon | 100.0 /100 | #46 | Exceptional 2.0% |
| Immigrants | Ukraine | 99.9 /100 | #47 | Exceptional 2.0% |
| Immigrants | Kazakhstan | 99.9 /100 | #48 | Exceptional 2.0% |
| Immigrants | Serbia | 99.9 /100 | #49 | Exceptional 2.0% |
| Immigrants | Switzerland | 99.9 /100 | #50 | Exceptional 2.0% |
| Immigrants | Poland | 99.9 /100 | #51 | Exceptional 2.0% |
| Immigrants | Europe | 99.9 /100 | #52 | Exceptional 2.0% |
| Immigrants | Northern Europe | 99.9 /100 | #53 | Exceptional 2.0% |
Demographics Similar to Aleuts by Single Father Households
In terms of single father households, the demographic groups most similar to Aleuts are Immigrants from Mexico (3.0%, a difference of 0.19%), Bangladeshi (3.1%, a difference of 0.88%), Fijian (3.0%, a difference of 1.4%), Immigrants from Cabo Verde (3.1%, a difference of 1.4%), and Immigrants from Central America (3.0%, a difference of 1.5%).
| Demographics | Rating | Rank | Single Father Households |
| Ute | 0.0 /100 | #319 | Tragic 3.0% |
| Guatemalans | 0.0 /100 | #320 | Tragic 3.0% |
| Mexicans | 0.0 /100 | #321 | Tragic 3.0% |
| Immigrants | Guatemala | 0.0 /100 | #322 | Tragic 3.0% |
| Immigrants | Central America | 0.0 /100 | #323 | Tragic 3.0% |
| Fijians | 0.0 /100 | #324 | Tragic 3.0% |
| Immigrants | Mexico | 0.0 /100 | #325 | Tragic 3.0% |
| Aleuts | 0.0 /100 | #326 | Tragic 3.0% |
| Bangladeshis | 0.0 /100 | #327 | Tragic 3.1% |
| Immigrants | Cabo Verde | 0.0 /100 | #328 | Tragic 3.1% |
| Chippewa | 0.0 /100 | #329 | Tragic 3.1% |
| Nepalese | 0.0 /100 | #330 | Tragic 3.1% |
| Navajo | 0.0 /100 | #331 | Tragic 3.2% |
| Yaqui | 0.0 /100 | #332 | Tragic 3.2% |
| Natives/Alaskans | 0.0 /100 | #333 | Tragic 3.2% |