Immigrants from Jordan vs Immigrants from West Indies 6th Grade
COMPARE
Immigrants from Jordan
Immigrants from West Indies
6th Grade
6th Grade Comparison
Immigrants from Jordan
Immigrants from West Indies
97.2%
6TH GRADE
73.0/ 100
METRIC RATING
152nd/ 347
METRIC RANK
96.1%
6TH GRADE
0.0/ 100
METRIC RATING
293rd/ 347
METRIC RANK
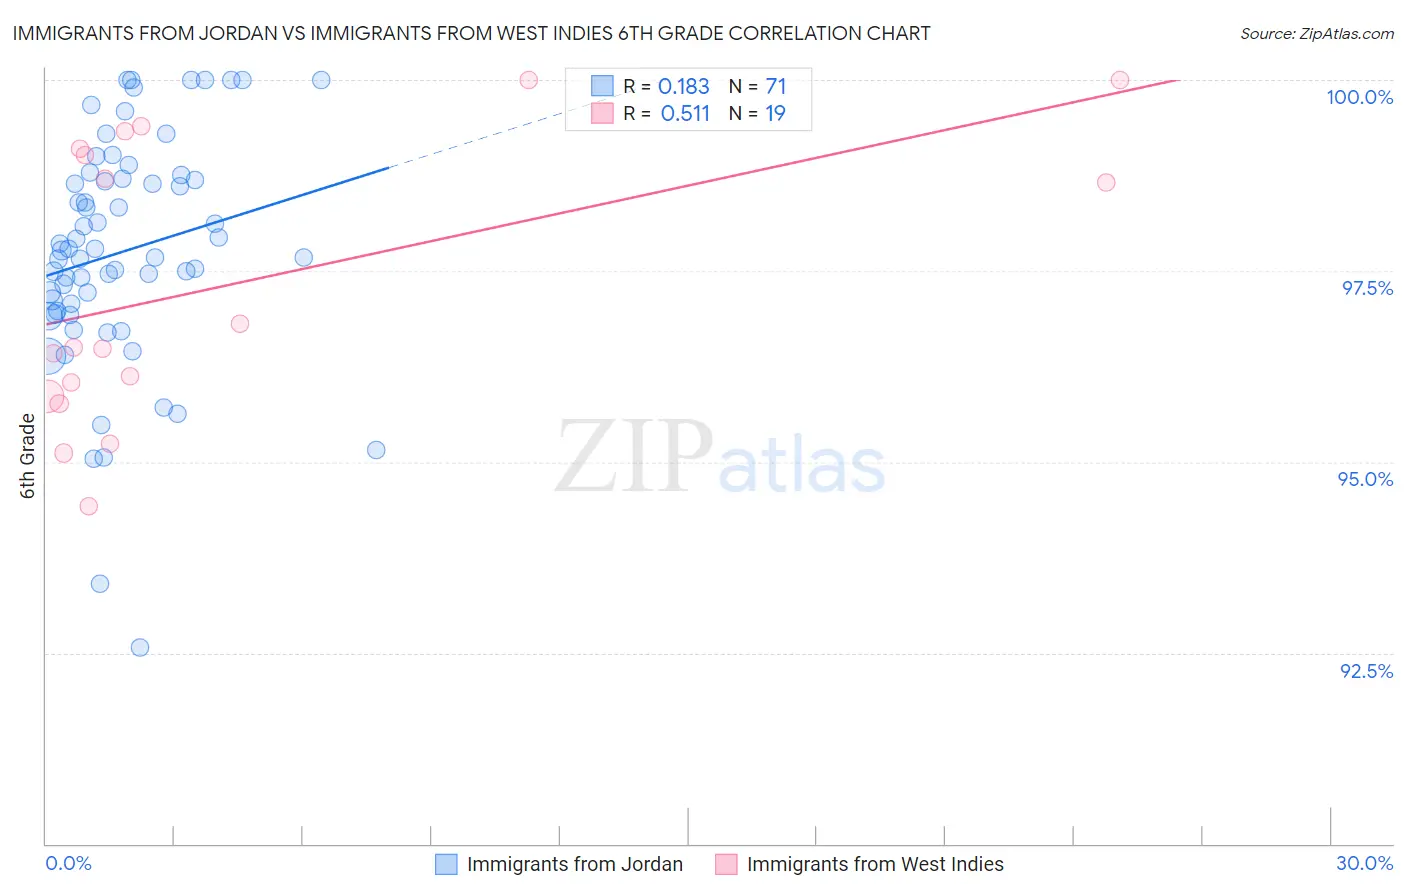
Immigrants from Jordan vs Immigrants from West Indies 6th Grade Correlation Chart
The statistical analysis conducted on geographies consisting of 181,269,915 people shows a poor positive correlation between the proportion of Immigrants from Jordan and percentage of population with at least 6th grade education in the United States with a correlation coefficient (R) of 0.183 and weighted average of 97.2%. Similarly, the statistical analysis conducted on geographies consisting of 72,457,514 people shows a substantial positive correlation between the proportion of Immigrants from West Indies and percentage of population with at least 6th grade education in the United States with a correlation coefficient (R) of 0.511 and weighted average of 96.1%, a difference of 1.1%.
6th Grade Correlation Summary
| Measurement | Immigrants from Jordan | Immigrants from West Indies |
| Minimum | 92.6% | 94.4% |
| Maximum | 100.0% | 100.0% |
| Range | 7.4% | 5.6% |
| Mean | 97.8% | 97.3% |
| Median | 97.8% | 96.5% |
| Interquartile 25% (IQ1) | 97.0% | 95.9% |
| Interquartile 75% (IQ3) | 98.7% | 99.1% |
| Interquartile Range (IQR) | 1.7% | 3.2% |
| Standard Deviation (Sample) | 1.5% | 1.8% |
| Standard Deviation (Population) | 1.5% | 1.8% |
Similar Demographics by 6th Grade
Demographics Similar to Immigrants from Jordan by 6th Grade
In terms of 6th grade, the demographic groups most similar to Immigrants from Jordan are Immigrants from Eastern Europe (97.2%, a difference of 0.0%), Immigrants from Bosnia and Herzegovina (97.2%, a difference of 0.010%), French American Indian (97.2%, a difference of 0.010%), Soviet Union (97.2%, a difference of 0.010%), and Ute (97.1%, a difference of 0.010%).
| Demographics | Rating | Rank | 6th Grade |
| Spaniards | 80.1 /100 | #145 | Excellent 97.2% |
| Hopi | 78.8 /100 | #146 | Good 97.2% |
| Immigrants | South Central Asia | 78.1 /100 | #147 | Good 97.2% |
| Immigrants | Greece | 77.8 /100 | #148 | Good 97.2% |
| Immigrants | Israel | 76.0 /100 | #149 | Good 97.2% |
| Immigrants | Bosnia and Herzegovina | 74.8 /100 | #150 | Good 97.2% |
| French American Indians | 74.0 /100 | #151 | Good 97.2% |
| Immigrants | Jordan | 73.0 /100 | #152 | Good 97.2% |
| Immigrants | Eastern Europe | 72.6 /100 | #153 | Good 97.2% |
| Soviet Union | 71.5 /100 | #154 | Good 97.2% |
| Ute | 71.1 /100 | #155 | Good 97.1% |
| Alsatians | 69.8 /100 | #156 | Good 97.1% |
| Immigrants | Russia | 67.6 /100 | #157 | Good 97.1% |
| Immigrants | Iran | 63.3 /100 | #158 | Good 97.1% |
| Kenyans | 62.9 /100 | #159 | Good 97.1% |
Demographics Similar to Immigrants from West Indies by 6th Grade
In terms of 6th grade, the demographic groups most similar to Immigrants from West Indies are Immigrants from Barbados (96.1%, a difference of 0.040%), Immigrants from Somalia (96.1%, a difference of 0.060%), Immigrants from St. Vincent and the Grenadines (96.1%, a difference of 0.060%), British West Indian (96.0%, a difference of 0.070%), and Immigrants from Eritrea (96.1%, a difference of 0.080%).
| Demographics | Rating | Rank | 6th Grade |
| Barbadians | 0.0 /100 | #286 | Tragic 96.2% |
| Immigrants | Trinidad and Tobago | 0.0 /100 | #287 | Tragic 96.2% |
| Malaysians | 0.0 /100 | #288 | Tragic 96.2% |
| Immigrants | Eritrea | 0.0 /100 | #289 | Tragic 96.1% |
| Immigrants | Somalia | 0.0 /100 | #290 | Tragic 96.1% |
| Immigrants | St. Vincent and the Grenadines | 0.0 /100 | #291 | Tragic 96.1% |
| Immigrants | Barbados | 0.0 /100 | #292 | Tragic 96.1% |
| Immigrants | West Indies | 0.0 /100 | #293 | Tragic 96.1% |
| British West Indians | 0.0 /100 | #294 | Tragic 96.0% |
| Immigrants | Grenada | 0.0 /100 | #295 | Tragic 95.9% |
| Immigrants | South Eastern Asia | 0.0 /100 | #296 | Tragic 95.9% |
| Haitians | 0.0 /100 | #297 | Tragic 95.8% |
| Sri Lankans | 0.0 /100 | #298 | Tragic 95.8% |
| Immigrants | Laos | 0.0 /100 | #299 | Tragic 95.7% |
| Immigrants | Dominica | 0.0 /100 | #300 | Tragic 95.7% |