Immigrants from Jordan vs French American Indian Child Poverty Among Girls Under 16
COMPARE
Immigrants from Jordan
French American Indian
Child Poverty Among Girls Under 16
Child Poverty Among Girls Under 16 Comparison
Immigrants from Jordan
French American Indians
15.6%
CHILD POVERTY AMONG GIRLS UNDER 16
87.2/ 100
METRIC RATING
141st/ 347
METRIC RANK
19.2%
CHILD POVERTY AMONG GIRLS UNDER 16
0.3/ 100
METRIC RATING
248th/ 347
METRIC RANK
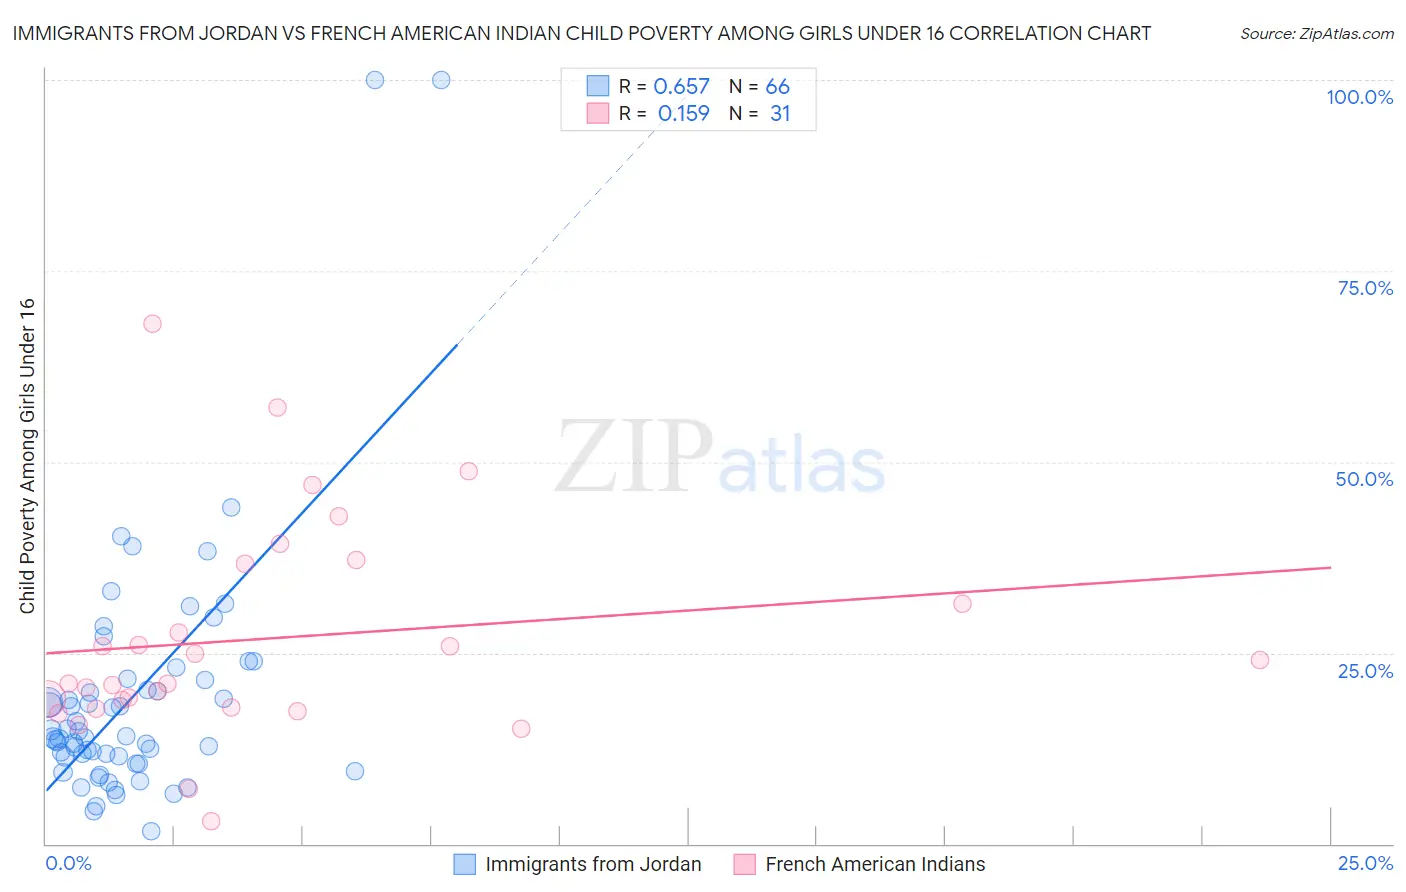
Immigrants from Jordan vs French American Indian Child Poverty Among Girls Under 16 Correlation Chart
The statistical analysis conducted on geographies consisting of 180,197,241 people shows a significant positive correlation between the proportion of Immigrants from Jordan and poverty level among girls under the age of 16 in the United States with a correlation coefficient (R) of 0.657 and weighted average of 15.6%. Similarly, the statistical analysis conducted on geographies consisting of 131,073,161 people shows a poor positive correlation between the proportion of French American Indians and poverty level among girls under the age of 16 in the United States with a correlation coefficient (R) of 0.159 and weighted average of 19.2%, a difference of 23.4%.
Child Poverty Among Girls Under 16 Correlation Summary
| Measurement | Immigrants from Jordan | French American Indian |
| Minimum | 1.6% | 3.0% |
| Maximum | 100.0% | 68.1% |
| Range | 98.4% | 65.1% |
| Mean | 19.3% | 26.9% |
| Median | 14.0% | 21.0% |
| Interquartile 25% (IQ1) | 11.4% | 17.8% |
| Interquartile 75% (IQ3) | 21.4% | 36.7% |
| Interquartile Range (IQR) | 10.0% | 18.9% |
| Standard Deviation (Sample) | 17.0% | 14.3% |
| Standard Deviation (Population) | 16.9% | 14.0% |
Similar Demographics by Child Poverty Among Girls Under 16
Demographics Similar to Immigrants from Jordan by Child Poverty Among Girls Under 16
In terms of child poverty among girls under 16, the demographic groups most similar to Immigrants from Jordan are New Zealander (15.6%, a difference of 0.010%), Canadian (15.6%, a difference of 0.020%), Immigrants from Peru (15.6%, a difference of 0.17%), Armenian (15.5%, a difference of 0.19%), and Israeli (15.6%, a difference of 0.26%).
| Demographics | Rating | Rank | Child Poverty Among Girls Under 16 |
| Immigrants | Spain | 89.1 /100 | #134 | Excellent 15.5% |
| Czechoslovakians | 89.0 /100 | #135 | Excellent 15.5% |
| Native Hawaiians | 89.0 /100 | #136 | Excellent 15.5% |
| South Africans | 88.7 /100 | #137 | Excellent 15.5% |
| Immigrants | Vietnam | 88.2 /100 | #138 | Excellent 15.5% |
| Armenians | 87.9 /100 | #139 | Excellent 15.5% |
| New Zealanders | 87.2 /100 | #140 | Excellent 15.6% |
| Immigrants | Jordan | 87.2 /100 | #141 | Excellent 15.6% |
| Canadians | 87.1 /100 | #142 | Excellent 15.6% |
| Immigrants | Peru | 86.6 /100 | #143 | Excellent 15.6% |
| Israelis | 86.3 /100 | #144 | Excellent 15.6% |
| Welsh | 85.4 /100 | #145 | Excellent 15.6% |
| Samoans | 84.2 /100 | #146 | Excellent 15.7% |
| Slavs | 83.1 /100 | #147 | Excellent 15.7% |
| Icelanders | 82.4 /100 | #148 | Excellent 15.7% |
Demographics Similar to French American Indians by Child Poverty Among Girls Under 16
In terms of child poverty among girls under 16, the demographic groups most similar to French American Indians are Potawatomi (19.2%, a difference of 0.020%), Cape Verdean (19.2%, a difference of 0.050%), Immigrants from Trinidad and Tobago (19.2%, a difference of 0.16%), Immigrants from Middle Africa (19.2%, a difference of 0.20%), and Immigrants from Guyana (19.3%, a difference of 0.39%).
| Demographics | Rating | Rank | Child Poverty Among Girls Under 16 |
| Americans | 0.8 /100 | #241 | Tragic 18.8% |
| Immigrants | Cuba | 0.7 /100 | #242 | Tragic 18.8% |
| Immigrants | Nicaragua | 0.7 /100 | #243 | Tragic 18.8% |
| Ecuadorians | 0.7 /100 | #244 | Tragic 18.8% |
| Shoshone | 0.6 /100 | #245 | Tragic 18.9% |
| Immigrants | Laos | 0.6 /100 | #246 | Tragic 18.9% |
| Immigrants | Ghana | 0.5 /100 | #247 | Tragic 18.9% |
| French American Indians | 0.3 /100 | #248 | Tragic 19.2% |
| Potawatomi | 0.3 /100 | #249 | Tragic 19.2% |
| Cape Verdeans | 0.3 /100 | #250 | Tragic 19.2% |
| Immigrants | Trinidad and Tobago | 0.3 /100 | #251 | Tragic 19.2% |
| Immigrants | Middle Africa | 0.3 /100 | #252 | Tragic 19.2% |
| Immigrants | Guyana | 0.3 /100 | #253 | Tragic 19.3% |
| Immigrants | Western Africa | 0.3 /100 | #254 | Tragic 19.3% |
| Immigrants | Ecuador | 0.3 /100 | #255 | Tragic 19.3% |