Immigrants from Indonesia vs French American Indian Child Poverty Among Girls Under 16
COMPARE
Immigrants from Indonesia
French American Indian
Child Poverty Among Girls Under 16
Child Poverty Among Girls Under 16 Comparison
Immigrants from Indonesia
French American Indians
14.4%
CHILD POVERTY AMONG GIRLS UNDER 16
98.9/ 100
METRIC RATING
56th/ 347
METRIC RANK
19.2%
CHILD POVERTY AMONG GIRLS UNDER 16
0.3/ 100
METRIC RATING
248th/ 347
METRIC RANK
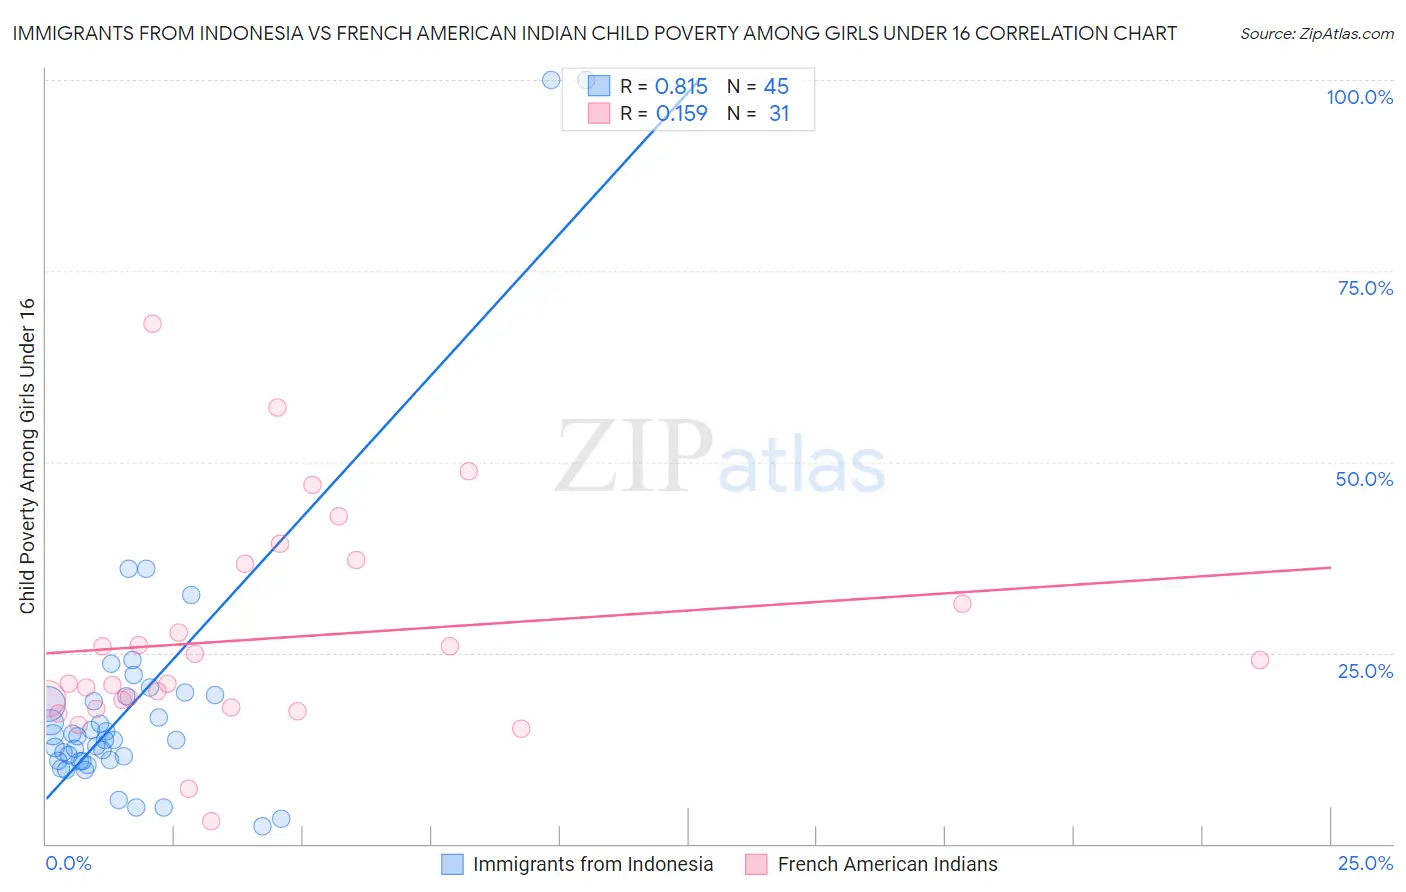
Immigrants from Indonesia vs French American Indian Child Poverty Among Girls Under 16 Correlation Chart
The statistical analysis conducted on geographies consisting of 213,789,101 people shows a very strong positive correlation between the proportion of Immigrants from Indonesia and poverty level among girls under the age of 16 in the United States with a correlation coefficient (R) of 0.815 and weighted average of 14.4%. Similarly, the statistical analysis conducted on geographies consisting of 131,073,161 people shows a poor positive correlation between the proportion of French American Indians and poverty level among girls under the age of 16 in the United States with a correlation coefficient (R) of 0.159 and weighted average of 19.2%, a difference of 33.8%.
Child Poverty Among Girls Under 16 Correlation Summary
| Measurement | Immigrants from Indonesia | French American Indian |
| Minimum | 2.3% | 3.0% |
| Maximum | 100.0% | 68.1% |
| Range | 97.7% | 65.1% |
| Mean | 18.7% | 26.9% |
| Median | 13.7% | 21.0% |
| Interquartile 25% (IQ1) | 10.9% | 17.8% |
| Interquartile 75% (IQ3) | 19.4% | 36.7% |
| Interquartile Range (IQR) | 8.5% | 18.9% |
| Standard Deviation (Sample) | 19.2% | 14.3% |
| Standard Deviation (Population) | 19.0% | 14.0% |
Similar Demographics by Child Poverty Among Girls Under 16
Demographics Similar to Immigrants from Indonesia by Child Poverty Among Girls Under 16
In terms of child poverty among girls under 16, the demographic groups most similar to Immigrants from Indonesia are Immigrants from Serbia (14.4%, a difference of 0.050%), Immigrants from Romania (14.3%, a difference of 0.080%), Estonian (14.3%, a difference of 0.12%), Immigrants from Bulgaria (14.4%, a difference of 0.13%), and Zimbabwean (14.4%, a difference of 0.19%).
| Demographics | Rating | Rank | Child Poverty Among Girls Under 16 |
| Greeks | 99.2 /100 | #49 | Exceptional 14.2% |
| Immigrants | Israel | 99.2 /100 | #50 | Exceptional 14.2% |
| Immigrants | Pakistan | 99.1 /100 | #51 | Exceptional 14.2% |
| Italians | 99.1 /100 | #52 | Exceptional 14.3% |
| Luxembourgers | 99.0 /100 | #53 | Exceptional 14.3% |
| Estonians | 98.9 /100 | #54 | Exceptional 14.3% |
| Immigrants | Romania | 98.9 /100 | #55 | Exceptional 14.3% |
| Immigrants | Indonesia | 98.9 /100 | #56 | Exceptional 14.4% |
| Immigrants | Serbia | 98.9 /100 | #57 | Exceptional 14.4% |
| Immigrants | Bulgaria | 98.8 /100 | #58 | Exceptional 14.4% |
| Zimbabweans | 98.8 /100 | #59 | Exceptional 14.4% |
| Poles | 98.7 /100 | #60 | Exceptional 14.4% |
| Cambodians | 98.7 /100 | #61 | Exceptional 14.4% |
| Scandinavians | 98.7 /100 | #62 | Exceptional 14.4% |
| Immigrants | Europe | 98.7 /100 | #63 | Exceptional 14.4% |
Demographics Similar to French American Indians by Child Poverty Among Girls Under 16
In terms of child poverty among girls under 16, the demographic groups most similar to French American Indians are Potawatomi (19.2%, a difference of 0.020%), Cape Verdean (19.2%, a difference of 0.050%), Immigrants from Trinidad and Tobago (19.2%, a difference of 0.16%), Immigrants from Middle Africa (19.2%, a difference of 0.20%), and Immigrants from Guyana (19.3%, a difference of 0.39%).
| Demographics | Rating | Rank | Child Poverty Among Girls Under 16 |
| Americans | 0.8 /100 | #241 | Tragic 18.8% |
| Immigrants | Cuba | 0.7 /100 | #242 | Tragic 18.8% |
| Immigrants | Nicaragua | 0.7 /100 | #243 | Tragic 18.8% |
| Ecuadorians | 0.7 /100 | #244 | Tragic 18.8% |
| Shoshone | 0.6 /100 | #245 | Tragic 18.9% |
| Immigrants | Laos | 0.6 /100 | #246 | Tragic 18.9% |
| Immigrants | Ghana | 0.5 /100 | #247 | Tragic 18.9% |
| French American Indians | 0.3 /100 | #248 | Tragic 19.2% |
| Potawatomi | 0.3 /100 | #249 | Tragic 19.2% |
| Cape Verdeans | 0.3 /100 | #250 | Tragic 19.2% |
| Immigrants | Trinidad and Tobago | 0.3 /100 | #251 | Tragic 19.2% |
| Immigrants | Middle Africa | 0.3 /100 | #252 | Tragic 19.2% |
| Immigrants | Guyana | 0.3 /100 | #253 | Tragic 19.3% |
| Immigrants | Western Africa | 0.3 /100 | #254 | Tragic 19.3% |
| Immigrants | Ecuador | 0.3 /100 | #255 | Tragic 19.3% |