Immigrants from Jordan vs French American Indian Median Male Earnings
COMPARE
Immigrants from Jordan
French American Indian
Median Male Earnings
Median Male Earnings Comparison
Immigrants from Jordan
French American Indians
$57,145
MEDIAN MALE EARNINGS
93.1/ 100
METRIC RATING
122nd/ 347
METRIC RANK
$50,611
MEDIAN MALE EARNINGS
2.2/ 100
METRIC RATING
243rd/ 347
METRIC RANK
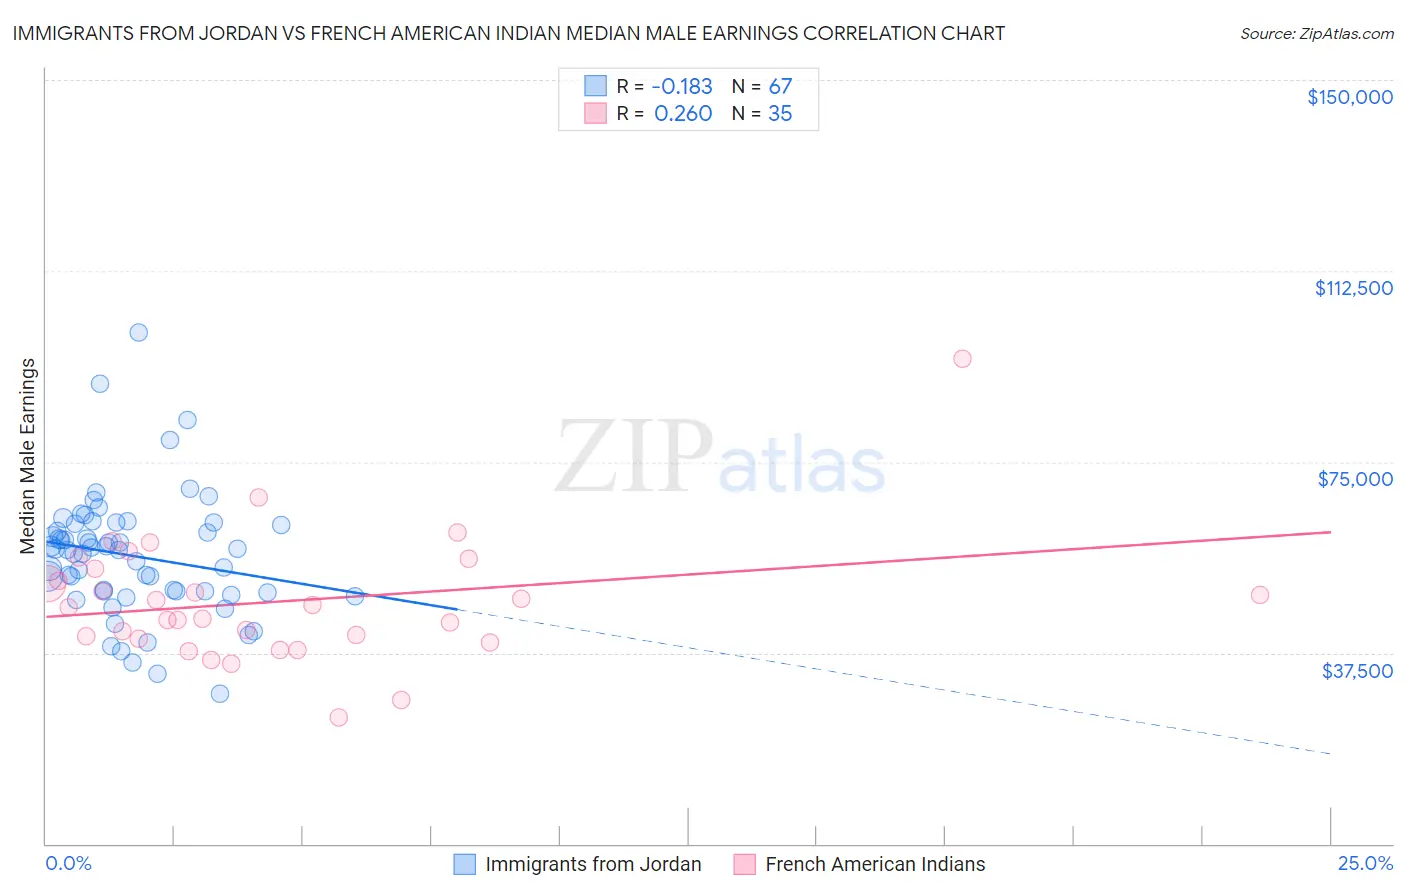
Immigrants from Jordan vs French American Indian Median Male Earnings Correlation Chart
The statistical analysis conducted on geographies consisting of 181,244,251 people shows a poor negative correlation between the proportion of Immigrants from Jordan and median male earnings in the United States with a correlation coefficient (R) of -0.183 and weighted average of $57,145. Similarly, the statistical analysis conducted on geographies consisting of 131,955,005 people shows a weak positive correlation between the proportion of French American Indians and median male earnings in the United States with a correlation coefficient (R) of 0.260 and weighted average of $50,611, a difference of 12.9%.
Median Male Earnings Correlation Summary
| Measurement | Immigrants from Jordan | French American Indian |
| Minimum | $29,414 | $24,718 |
| Maximum | $100,501 | $95,250 |
| Range | $71,087 | $70,532 |
| Mean | $56,566 | $47,583 |
| Median | $57,678 | $46,502 |
| Interquartile 25% (IQ1) | $49,640 | $40,215 |
| Interquartile 75% (IQ3) | $62,778 | $53,921 |
| Interquartile Range (IQR) | $13,138 | $13,706 |
| Standard Deviation (Sample) | $12,126 | $12,435 |
| Standard Deviation (Population) | $12,035 | $12,256 |
Similar Demographics by Median Male Earnings
Demographics Similar to Immigrants from Jordan by Median Male Earnings
In terms of median male earnings, the demographic groups most similar to Immigrants from Jordan are Slovene ($57,145, a difference of 0.0%), Immigrants from Albania ($57,179, a difference of 0.060%), Canadian ($57,286, a difference of 0.25%), Arab ($57,298, a difference of 0.27%), and Hungarian ($57,309, a difference of 0.29%).
| Demographics | Rating | Rank | Median Male Earnings |
| Swedes | 94.8 /100 | #115 | Exceptional $57,445 |
| Lebanese | 94.6 /100 | #116 | Exceptional $57,409 |
| Immigrants | Zimbabwe | 94.3 /100 | #117 | Exceptional $57,352 |
| Hungarians | 94.0 /100 | #118 | Exceptional $57,309 |
| Arabs | 94.0 /100 | #119 | Exceptional $57,298 |
| Canadians | 93.9 /100 | #120 | Exceptional $57,286 |
| Immigrants | Albania | 93.3 /100 | #121 | Exceptional $57,179 |
| Immigrants | Jordan | 93.1 /100 | #122 | Exceptional $57,145 |
| Slovenes | 93.1 /100 | #123 | Exceptional $57,145 |
| Chileans | 91.9 /100 | #124 | Exceptional $56,973 |
| Immigrants | Morocco | 91.8 /100 | #125 | Exceptional $56,958 |
| Chinese | 91.1 /100 | #126 | Exceptional $56,872 |
| Brazilians | 90.9 /100 | #127 | Exceptional $56,837 |
| Immigrants | Syria | 90.8 /100 | #128 | Exceptional $56,830 |
| Pakistanis | 89.9 /100 | #129 | Excellent $56,719 |
Demographics Similar to French American Indians by Median Male Earnings
In terms of median male earnings, the demographic groups most similar to French American Indians are Guyanese ($50,613, a difference of 0.0%), Immigrants from St. Vincent and the Grenadines ($50,665, a difference of 0.11%), Houma ($50,547, a difference of 0.13%), West Indian ($50,682, a difference of 0.14%), and Hawaiian ($50,488, a difference of 0.24%).
| Demographics | Rating | Rank | Median Male Earnings |
| Pennsylvania Germans | 2.8 /100 | #236 | Tragic $50,878 |
| Immigrants | Barbados | 2.6 /100 | #237 | Tragic $50,795 |
| Malaysians | 2.5 /100 | #238 | Tragic $50,772 |
| Americans | 2.5 /100 | #239 | Tragic $50,761 |
| West Indians | 2.3 /100 | #240 | Tragic $50,682 |
| Immigrants | St. Vincent and the Grenadines | 2.3 /100 | #241 | Tragic $50,665 |
| Guyanese | 2.2 /100 | #242 | Tragic $50,613 |
| French American Indians | 2.2 /100 | #243 | Tragic $50,611 |
| Houma | 2.0 /100 | #244 | Tragic $50,547 |
| Hawaiians | 1.9 /100 | #245 | Tragic $50,488 |
| Immigrants | Ecuador | 1.9 /100 | #246 | Tragic $50,474 |
| Sub-Saharan Africans | 1.8 /100 | #247 | Tragic $50,408 |
| Immigrants | Guyana | 1.6 /100 | #248 | Tragic $50,321 |
| Immigrants | Burma/Myanmar | 1.6 /100 | #249 | Tragic $50,298 |
| Osage | 1.6 /100 | #250 | Tragic $50,292 |