Immigrants from Iran vs Korean Female Poverty
COMPARE
Immigrants from Iran
Korean
Female Poverty
Female Poverty Comparison
Immigrants from Iran
Koreans
11.8%
FEMALE POVERTY
99.4/ 100
METRIC RATING
35th/ 347
METRIC RANK
11.9%
FEMALE POVERTY
99.2/ 100
METRIC RATING
43rd/ 347
METRIC RANK
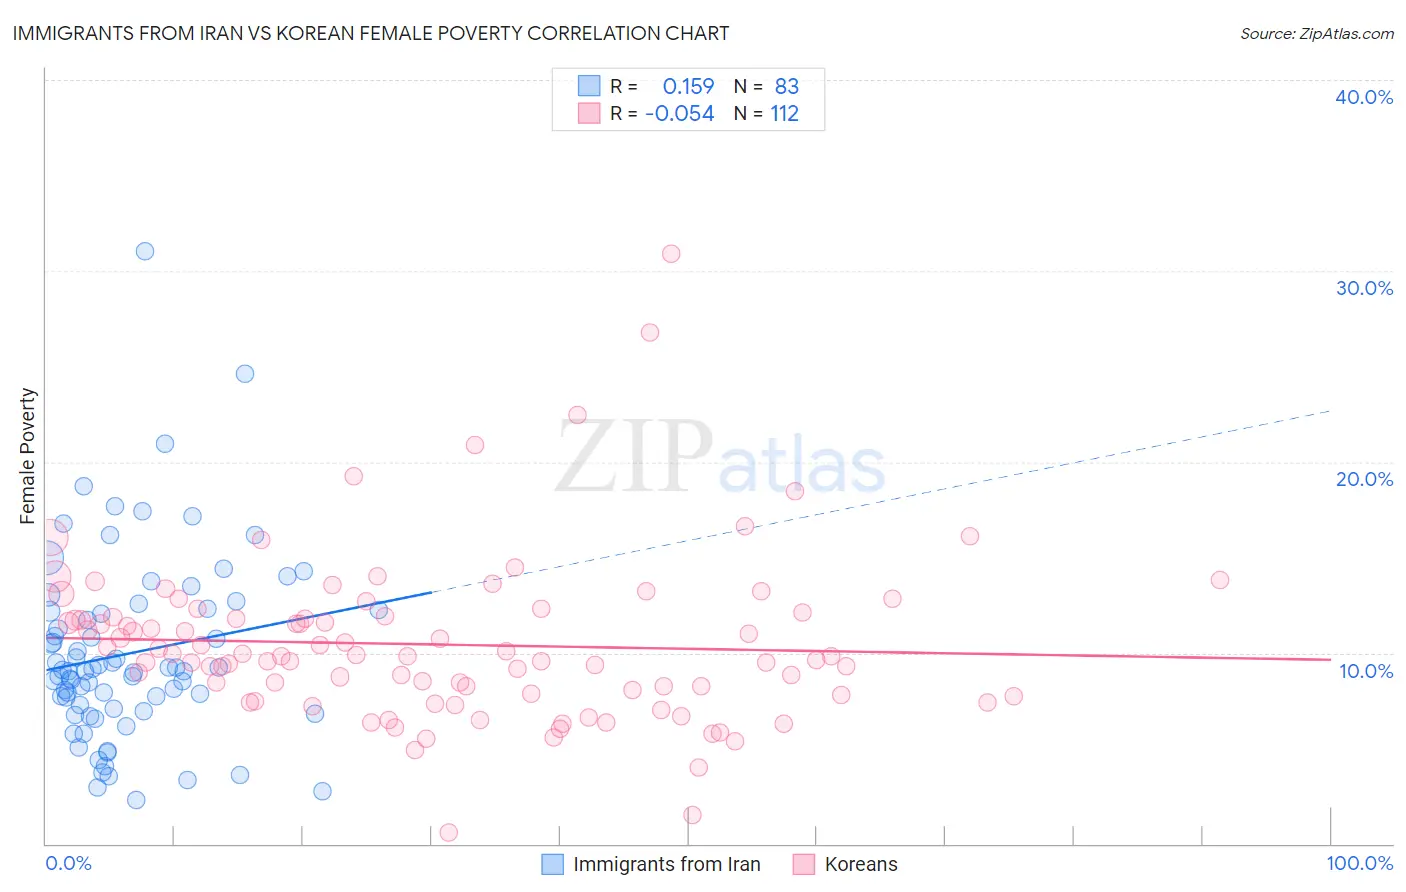
Immigrants from Iran vs Korean Female Poverty Correlation Chart
The statistical analysis conducted on geographies consisting of 279,829,066 people shows a poor positive correlation between the proportion of Immigrants from Iran and poverty level among females in the United States with a correlation coefficient (R) of 0.159 and weighted average of 11.8%. Similarly, the statistical analysis conducted on geographies consisting of 510,221,953 people shows a slight negative correlation between the proportion of Koreans and poverty level among females in the United States with a correlation coefficient (R) of -0.054 and weighted average of 11.9%, a difference of 0.76%.
Female Poverty Correlation Summary
| Measurement | Immigrants from Iran | Korean |
| Minimum | 2.3% | 0.57% |
| Maximum | 31.0% | 30.9% |
| Range | 28.7% | 30.3% |
| Mean | 10.0% | 10.4% |
| Median | 9.1% | 9.8% |
| Interquartile 25% (IQ1) | 7.0% | 7.9% |
| Interquartile 75% (IQ3) | 12.3% | 11.9% |
| Interquartile Range (IQR) | 5.2% | 4.0% |
| Standard Deviation (Sample) | 4.9% | 4.3% |
| Standard Deviation (Population) | 4.8% | 4.3% |
Demographics Similar to Immigrants from Iran and Koreans by Female Poverty
In terms of female poverty, the demographic groups most similar to Immigrants from Iran are Immigrants from Singapore (11.8%, a difference of 0.17%), Immigrants from Pakistan (11.8%, a difference of 0.17%), Immigrants from Greece (11.8%, a difference of 0.27%), Russian (11.8%, a difference of 0.28%), and Cypriot (11.8%, a difference of 0.29%). Similarly, the demographic groups most similar to Koreans are Czech (11.9%, a difference of 0.040%), Immigrants from Moldova (11.9%, a difference of 0.040%), Tongan (11.9%, a difference of 0.070%), Immigrants from Czechoslovakia (11.9%, a difference of 0.16%), and Turkish (11.9%, a difference of 0.16%).
| Demographics | Rating | Rank | Female Poverty |
| Immigrants | North Macedonia | 99.6 /100 | #29 | Exceptional 11.7% |
| Greeks | 99.5 /100 | #30 | Exceptional 11.7% |
| Poles | 99.5 /100 | #31 | Exceptional 11.7% |
| Danes | 99.5 /100 | #32 | Exceptional 11.7% |
| Cypriots | 99.5 /100 | #33 | Exceptional 11.8% |
| Immigrants | Singapore | 99.4 /100 | #34 | Exceptional 11.8% |
| Immigrants | Iran | 99.4 /100 | #35 | Exceptional 11.8% |
| Immigrants | Pakistan | 99.4 /100 | #36 | Exceptional 11.8% |
| Immigrants | Greece | 99.3 /100 | #37 | Exceptional 11.8% |
| Russians | 99.3 /100 | #38 | Exceptional 11.8% |
| Immigrants | Poland | 99.3 /100 | #39 | Exceptional 11.8% |
| Macedonians | 99.3 /100 | #40 | Exceptional 11.8% |
| Czechs | 99.2 /100 | #41 | Exceptional 11.9% |
| Immigrants | Moldova | 99.2 /100 | #42 | Exceptional 11.9% |
| Koreans | 99.2 /100 | #43 | Exceptional 11.9% |
| Tongans | 99.2 /100 | #44 | Exceptional 11.9% |
| Immigrants | Czechoslovakia | 99.2 /100 | #45 | Exceptional 11.9% |
| Turks | 99.2 /100 | #46 | Exceptional 11.9% |
| Asians | 99.1 /100 | #47 | Exceptional 11.9% |
| Immigrants | Japan | 99.0 /100 | #48 | Exceptional 11.9% |
| Immigrants | Romania | 99.0 /100 | #49 | Exceptional 12.0% |