Immigrants from Iran vs Immigrants from South Central Asia Female Poverty
COMPARE
Immigrants from Iran
Immigrants from South Central Asia
Female Poverty
Female Poverty Comparison
Immigrants from Iran
Immigrants from South Central Asia
11.8%
FEMALE POVERTY
99.4/ 100
METRIC RATING
35th/ 347
METRIC RANK
11.1%
FEMALE POVERTY
99.9/ 100
METRIC RATING
8th/ 347
METRIC RANK
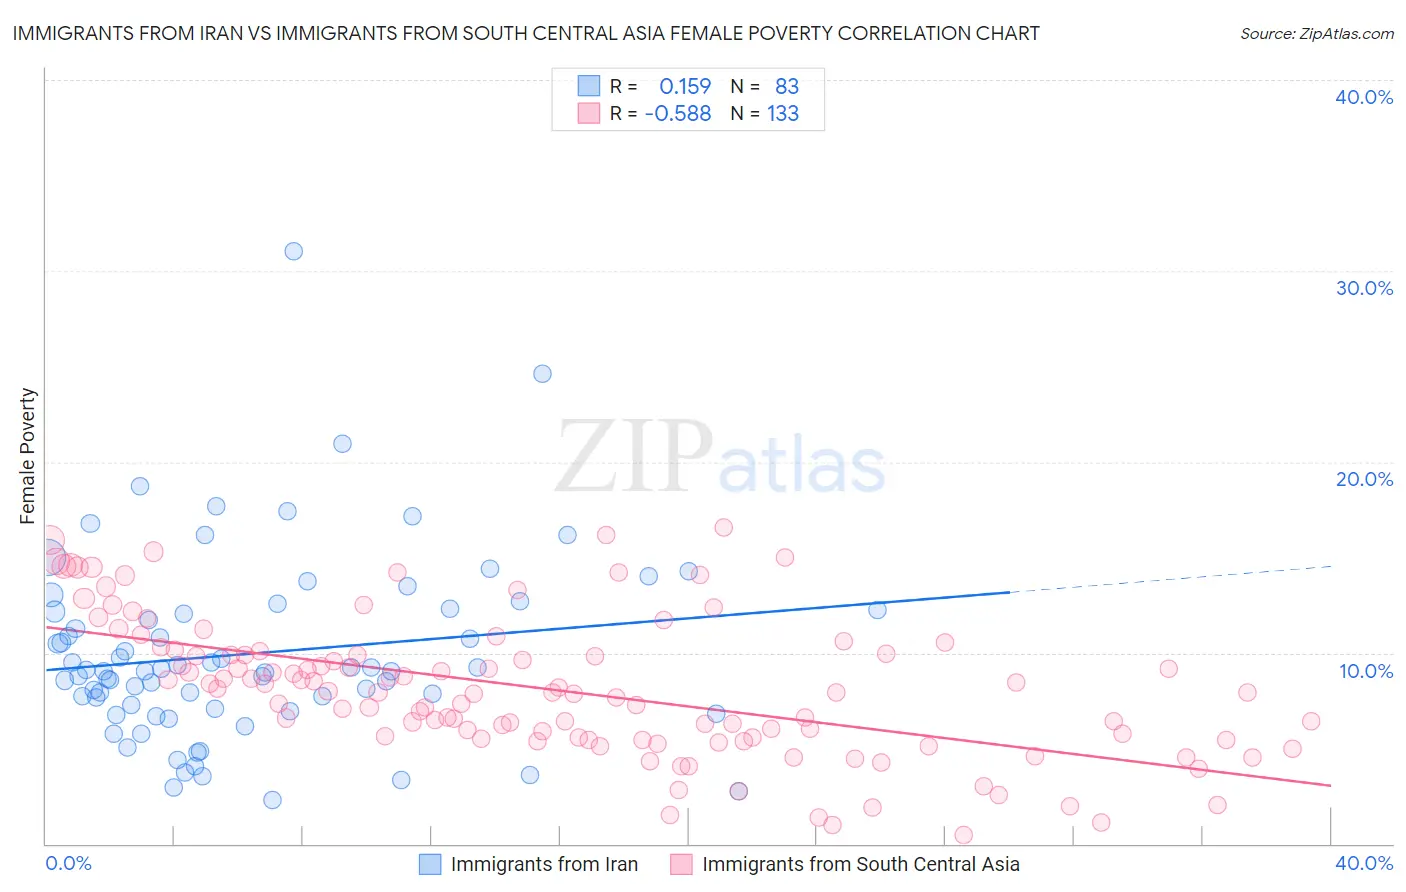
Immigrants from Iran vs Immigrants from South Central Asia Female Poverty Correlation Chart
The statistical analysis conducted on geographies consisting of 279,829,066 people shows a poor positive correlation between the proportion of Immigrants from Iran and poverty level among females in the United States with a correlation coefficient (R) of 0.159 and weighted average of 11.8%. Similarly, the statistical analysis conducted on geographies consisting of 472,522,923 people shows a substantial negative correlation between the proportion of Immigrants from South Central Asia and poverty level among females in the United States with a correlation coefficient (R) of -0.588 and weighted average of 11.1%, a difference of 6.1%.
Female Poverty Correlation Summary
| Measurement | Immigrants from Iran | Immigrants from South Central Asia |
| Minimum | 2.3% | 0.46% |
| Maximum | 31.0% | 16.5% |
| Range | 28.7% | 16.1% |
| Mean | 10.0% | 8.1% |
| Median | 9.1% | 7.9% |
| Interquartile 25% (IQ1) | 7.0% | 5.5% |
| Interquartile 75% (IQ3) | 12.3% | 10.0% |
| Interquartile Range (IQR) | 5.2% | 4.5% |
| Standard Deviation (Sample) | 4.9% | 3.6% |
| Standard Deviation (Population) | 4.8% | 3.6% |
Similar Demographics by Female Poverty
Demographics Similar to Immigrants from Iran by Female Poverty
In terms of female poverty, the demographic groups most similar to Immigrants from Iran are Immigrants from Singapore (11.8%, a difference of 0.17%), Immigrants from Pakistan (11.8%, a difference of 0.17%), Immigrants from Greece (11.8%, a difference of 0.27%), Russian (11.8%, a difference of 0.28%), and Cypriot (11.8%, a difference of 0.29%).
| Demographics | Rating | Rank | Female Poverty |
| Immigrants | Korea | 99.6 /100 | #28 | Exceptional 11.7% |
| Immigrants | North Macedonia | 99.6 /100 | #29 | Exceptional 11.7% |
| Greeks | 99.5 /100 | #30 | Exceptional 11.7% |
| Poles | 99.5 /100 | #31 | Exceptional 11.7% |
| Danes | 99.5 /100 | #32 | Exceptional 11.7% |
| Cypriots | 99.5 /100 | #33 | Exceptional 11.8% |
| Immigrants | Singapore | 99.4 /100 | #34 | Exceptional 11.8% |
| Immigrants | Iran | 99.4 /100 | #35 | Exceptional 11.8% |
| Immigrants | Pakistan | 99.4 /100 | #36 | Exceptional 11.8% |
| Immigrants | Greece | 99.3 /100 | #37 | Exceptional 11.8% |
| Russians | 99.3 /100 | #38 | Exceptional 11.8% |
| Immigrants | Poland | 99.3 /100 | #39 | Exceptional 11.8% |
| Macedonians | 99.3 /100 | #40 | Exceptional 11.8% |
| Czechs | 99.2 /100 | #41 | Exceptional 11.9% |
| Immigrants | Moldova | 99.2 /100 | #42 | Exceptional 11.9% |
Demographics Similar to Immigrants from South Central Asia by Female Poverty
In terms of female poverty, the demographic groups most similar to Immigrants from South Central Asia are Bulgarian (11.1%, a difference of 0.19%), Assyrian/Chaldean/Syriac (11.0%, a difference of 0.70%), Immigrants from Hong Kong (11.2%, a difference of 0.99%), Immigrants from Ireland (11.0%, a difference of 1.1%), and Maltese (11.2%, a difference of 1.1%).
| Demographics | Rating | Rank | Female Poverty |
| Immigrants | India | 100.0 /100 | #1 | Exceptional 9.9% |
| Chinese | 100.0 /100 | #2 | Exceptional 10.4% |
| Thais | 100.0 /100 | #3 | Exceptional 10.5% |
| Immigrants | Taiwan | 100.0 /100 | #4 | Exceptional 10.5% |
| Filipinos | 100.0 /100 | #5 | Exceptional 10.9% |
| Immigrants | Ireland | 99.9 /100 | #6 | Exceptional 11.0% |
| Assyrians/Chaldeans/Syriacs | 99.9 /100 | #7 | Exceptional 11.0% |
| Immigrants | South Central Asia | 99.9 /100 | #8 | Exceptional 11.1% |
| Bulgarians | 99.9 /100 | #9 | Exceptional 11.1% |
| Immigrants | Hong Kong | 99.9 /100 | #10 | Exceptional 11.2% |
| Maltese | 99.9 /100 | #11 | Exceptional 11.2% |
| Bhutanese | 99.9 /100 | #12 | Exceptional 11.3% |
| Immigrants | Lithuania | 99.9 /100 | #13 | Exceptional 11.3% |
| Lithuanians | 99.8 /100 | #14 | Exceptional 11.4% |
| Latvians | 99.8 /100 | #15 | Exceptional 11.4% |