Immigrants from Iran vs Sioux Disability Age Over 75
COMPARE
Immigrants from Iran
Sioux
Disability Age Over 75
Disability Age Over 75 Comparison
Immigrants from Iran
Sioux
47.1%
DISABILITY AGE OVER 75
74.7/ 100
METRIC RATING
155th/ 347
METRIC RANK
49.7%
DISABILITY AGE OVER 75
0.0/ 100
METRIC RATING
287th/ 347
METRIC RANK
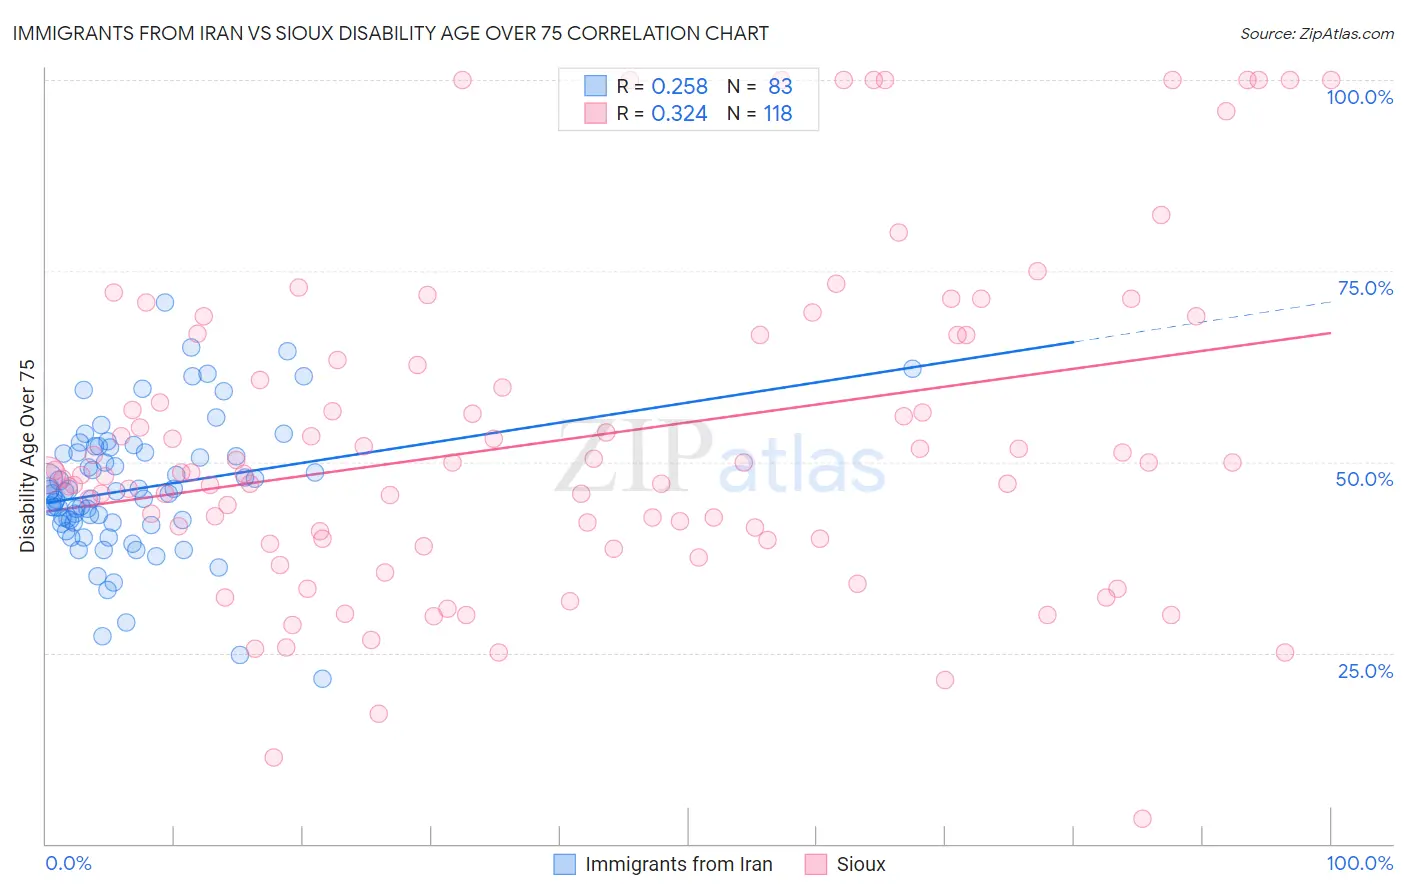
Immigrants from Iran vs Sioux Disability Age Over 75 Correlation Chart
The statistical analysis conducted on geographies consisting of 279,744,511 people shows a weak positive correlation between the proportion of Immigrants from Iran and percentage of population with a disability over the age of 75 in the United States with a correlation coefficient (R) of 0.258 and weighted average of 47.1%. Similarly, the statistical analysis conducted on geographies consisting of 233,802,290 people shows a mild positive correlation between the proportion of Sioux and percentage of population with a disability over the age of 75 in the United States with a correlation coefficient (R) of 0.324 and weighted average of 49.7%, a difference of 5.7%.
Disability Age Over 75 Correlation Summary
| Measurement | Immigrants from Iran | Sioux |
| Minimum | 21.6% | 3.3% |
| Maximum | 70.8% | 100.0% |
| Range | 49.3% | 96.7% |
| Mean | 46.5% | 53.0% |
| Median | 46.1% | 48.6% |
| Interquartile 25% (IQ1) | 42.1% | 40.0% |
| Interquartile 75% (IQ3) | 51.2% | 66.7% |
| Interquartile Range (IQR) | 9.2% | 26.7% |
| Standard Deviation (Sample) | 8.8% | 21.3% |
| Standard Deviation (Population) | 8.8% | 21.2% |
Similar Demographics by Disability Age Over 75
Demographics Similar to Immigrants from Iran by Disability Age Over 75
In terms of disability age over 75, the demographic groups most similar to Immigrants from Iran are Immigrants from Belarus (47.1%, a difference of 0.0%), Immigrants from Zaire (47.1%, a difference of 0.010%), Arab (47.1%, a difference of 0.040%), Immigrants from Asia (47.0%, a difference of 0.060%), and Bhutanese (47.1%, a difference of 0.060%).
| Demographics | Rating | Rank | Disability Age Over 75 |
| Asians | 81.6 /100 | #148 | Excellent 46.9% |
| Welsh | 81.3 /100 | #149 | Excellent 47.0% |
| Immigrants | Russia | 79.3 /100 | #150 | Good 47.0% |
| French Canadians | 79.0 /100 | #151 | Good 47.0% |
| Immigrants | Asia | 76.5 /100 | #152 | Good 47.0% |
| Immigrants | Zaire | 74.8 /100 | #153 | Good 47.1% |
| Immigrants | Belarus | 74.8 /100 | #154 | Good 47.1% |
| Immigrants | Iran | 74.7 /100 | #155 | Good 47.1% |
| Arabs | 73.3 /100 | #156 | Good 47.1% |
| Bhutanese | 72.6 /100 | #157 | Good 47.1% |
| Immigrants | Guyana | 71.9 /100 | #158 | Good 47.1% |
| Immigrants | Morocco | 71.4 /100 | #159 | Good 47.1% |
| Immigrants | Middle Africa | 68.3 /100 | #160 | Good 47.1% |
| South American Indians | 68.1 /100 | #161 | Good 47.1% |
| Pennsylvania Germans | 66.0 /100 | #162 | Good 47.2% |
Demographics Similar to Sioux by Disability Age Over 75
In terms of disability age over 75, the demographic groups most similar to Sioux are Yaqui (49.8%, a difference of 0.050%), Osage (49.8%, a difference of 0.13%), Puget Sound Salish (49.8%, a difference of 0.14%), Arapaho (49.8%, a difference of 0.14%), and Immigrants from Belize (49.6%, a difference of 0.21%).
| Demographics | Rating | Rank | Disability Age Over 75 |
| Bangladeshis | 0.0 /100 | #280 | Tragic 49.4% |
| Belizeans | 0.0 /100 | #281 | Tragic 49.4% |
| Blacks/African Americans | 0.0 /100 | #282 | Tragic 49.5% |
| Samoans | 0.0 /100 | #283 | Tragic 49.5% |
| Immigrants | Latin America | 0.0 /100 | #284 | Tragic 49.5% |
| Crow | 0.0 /100 | #285 | Tragic 49.6% |
| Immigrants | Belize | 0.0 /100 | #286 | Tragic 49.6% |
| Sioux | 0.0 /100 | #287 | Tragic 49.7% |
| Yaqui | 0.0 /100 | #288 | Tragic 49.8% |
| Osage | 0.0 /100 | #289 | Tragic 49.8% |
| Puget Sound Salish | 0.0 /100 | #290 | Tragic 49.8% |
| Arapaho | 0.0 /100 | #291 | Tragic 49.8% |
| Shoshone | 0.0 /100 | #292 | Tragic 49.9% |
| Spanish American Indians | 0.0 /100 | #293 | Tragic 49.9% |
| Immigrants | Cambodia | 0.0 /100 | #294 | Tragic 50.0% |