Immigrants from Iran vs Immigrants from China Married-Couple Family Poverty
COMPARE
Immigrants from Iran
Immigrants from China
Married-Couple Family Poverty
Married-Couple Family Poverty Comparison
Immigrants from Iran
Immigrants from China
4.5%
MARRIED-COUPLE FAMILY POVERTY
99.0/ 100
METRIC RATING
79th/ 347
METRIC RANK
5.0%
MARRIED-COUPLE FAMILY POVERTY
84.6/ 100
METRIC RATING
142nd/ 347
METRIC RANK
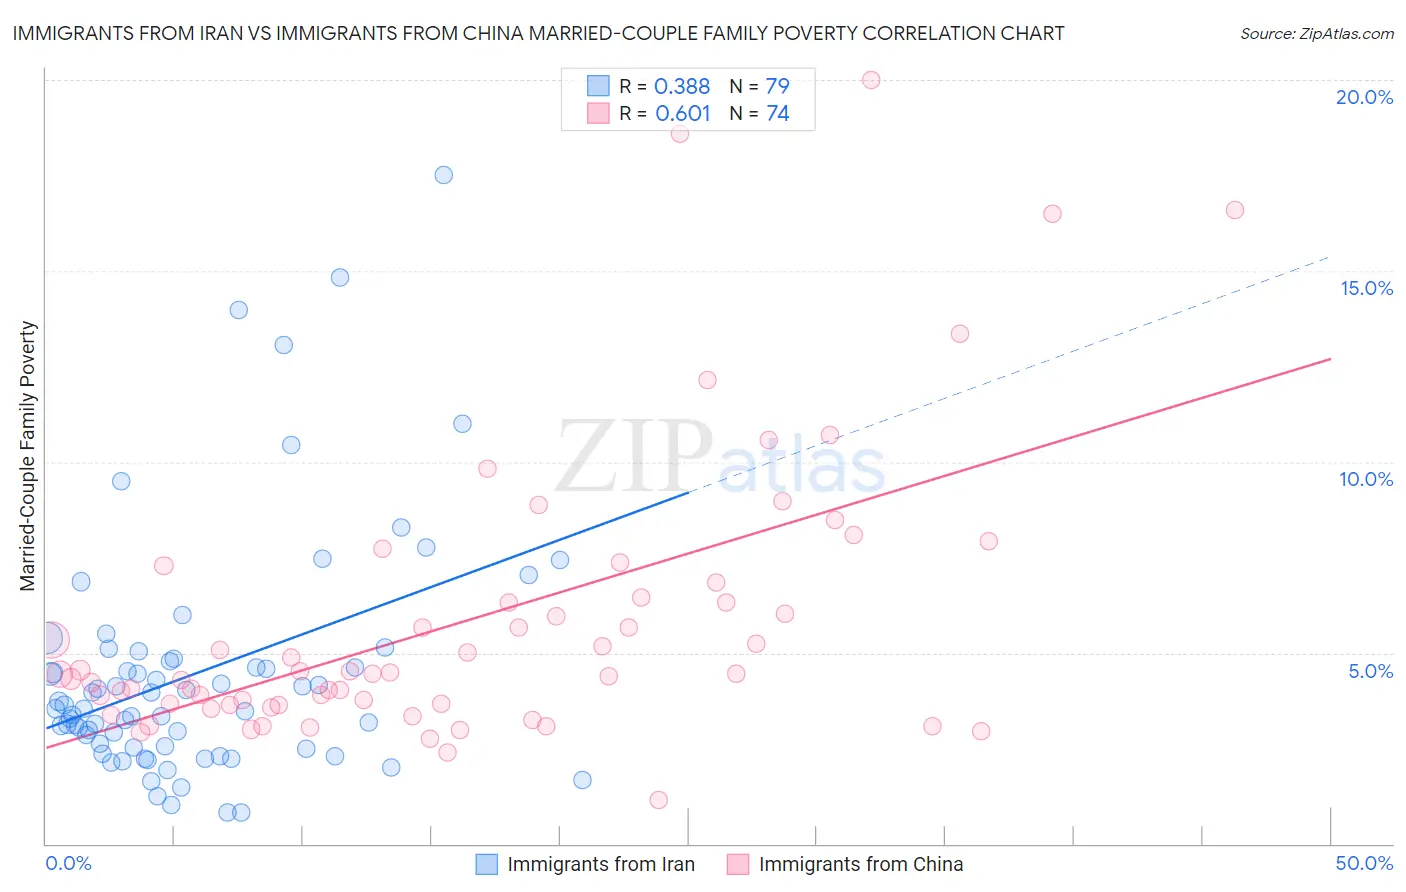
Immigrants from Iran vs Immigrants from China Married-Couple Family Poverty Correlation Chart
The statistical analysis conducted on geographies consisting of 278,379,218 people shows a mild positive correlation between the proportion of Immigrants from Iran and poverty level among married-couple families in the United States with a correlation coefficient (R) of 0.388 and weighted average of 4.5%. Similarly, the statistical analysis conducted on geographies consisting of 451,197,331 people shows a significant positive correlation between the proportion of Immigrants from China and poverty level among married-couple families in the United States with a correlation coefficient (R) of 0.601 and weighted average of 5.0%, a difference of 9.7%.
Married-Couple Family Poverty Correlation Summary
| Measurement | Immigrants from Iran | Immigrants from China |
| Minimum | 0.82% | 1.1% |
| Maximum | 17.5% | 20.0% |
| Range | 16.7% | 18.9% |
| Mean | 4.5% | 5.8% |
| Median | 3.5% | 4.5% |
| Interquartile 25% (IQ1) | 2.5% | 3.6% |
| Interquartile 75% (IQ3) | 4.9% | 6.5% |
| Interquartile Range (IQR) | 2.3% | 2.8% |
| Standard Deviation (Sample) | 3.2% | 3.7% |
| Standard Deviation (Population) | 3.2% | 3.7% |
Similar Demographics by Married-Couple Family Poverty
Demographics Similar to Immigrants from Iran by Married-Couple Family Poverty
In terms of married-couple family poverty, the demographic groups most similar to Immigrants from Iran are Icelander (4.5%, a difference of 0.060%), Immigrants from Greece (4.5%, a difference of 0.20%), Scotch-Irish (4.5%, a difference of 0.23%), Immigrants from Latvia (4.5%, a difference of 0.31%), and Canadian (4.5%, a difference of 0.45%).
| Demographics | Rating | Rank | Married-Couple Family Poverty |
| Immigrants | England | 99.3 /100 | #72 | Exceptional 4.5% |
| Ukrainians | 99.2 /100 | #73 | Exceptional 4.5% |
| Immigrants | Austria | 99.2 /100 | #74 | Exceptional 4.5% |
| Cambodians | 99.2 /100 | #75 | Exceptional 4.5% |
| Immigrants | South Africa | 99.1 /100 | #76 | Exceptional 4.5% |
| Immigrants | Latvia | 99.1 /100 | #77 | Exceptional 4.5% |
| Scotch-Irish | 99.1 /100 | #78 | Exceptional 4.5% |
| Immigrants | Iran | 99.0 /100 | #79 | Exceptional 4.5% |
| Icelanders | 99.0 /100 | #80 | Exceptional 4.5% |
| Immigrants | Greece | 98.9 /100 | #81 | Exceptional 4.5% |
| Canadians | 98.8 /100 | #82 | Exceptional 4.5% |
| Immigrants | Denmark | 98.8 /100 | #83 | Exceptional 4.6% |
| Immigrants | Croatia | 98.7 /100 | #84 | Exceptional 4.6% |
| South Africans | 98.7 /100 | #85 | Exceptional 4.6% |
| Immigrants | Turkey | 98.6 /100 | #86 | Exceptional 4.6% |
Demographics Similar to Immigrants from China by Married-Couple Family Poverty
In terms of married-couple family poverty, the demographic groups most similar to Immigrants from China are Immigrants from Brazil (5.0%, a difference of 0.0%), Immigrants from Portugal (5.0%, a difference of 0.050%), German Russian (5.0%, a difference of 0.11%), Immigrants from Egypt (5.0%, a difference of 0.27%), and Hmong (5.0%, a difference of 0.32%).
| Demographics | Rating | Rank | Married-Couple Family Poverty |
| Assyrians/Chaldeans/Syriacs | 89.4 /100 | #135 | Excellent 4.9% |
| Immigrants | Hungary | 88.7 /100 | #136 | Excellent 4.9% |
| Guamanians/Chamorros | 86.5 /100 | #137 | Excellent 4.9% |
| Chileans | 86.0 /100 | #138 | Excellent 4.9% |
| German Russians | 85.1 /100 | #139 | Excellent 5.0% |
| Immigrants | Portugal | 84.8 /100 | #140 | Excellent 5.0% |
| Immigrants | Brazil | 84.6 /100 | #141 | Excellent 5.0% |
| Immigrants | China | 84.6 /100 | #142 | Excellent 5.0% |
| Immigrants | Egypt | 83.4 /100 | #143 | Excellent 5.0% |
| Hmong | 83.2 /100 | #144 | Excellent 5.0% |
| Immigrants | Spain | 79.9 /100 | #145 | Good 5.0% |
| Mongolians | 79.8 /100 | #146 | Good 5.0% |
| Syrians | 78.7 /100 | #147 | Good 5.0% |
| Immigrants | Russia | 78.7 /100 | #148 | Good 5.0% |
| Immigrants | Oceania | 78.6 /100 | #149 | Good 5.0% |