Immigrants from Iran vs Immigrants from China Male Poverty
COMPARE
Immigrants from Iran
Immigrants from China
Male Poverty
Male Poverty Comparison
Immigrants from Iran
Immigrants from China
9.9%
MALE POVERTY
99.1/ 100
METRIC RATING
42nd/ 347
METRIC RANK
10.7%
MALE POVERTY
87.1/ 100
METRIC RATING
120th/ 347
METRIC RANK
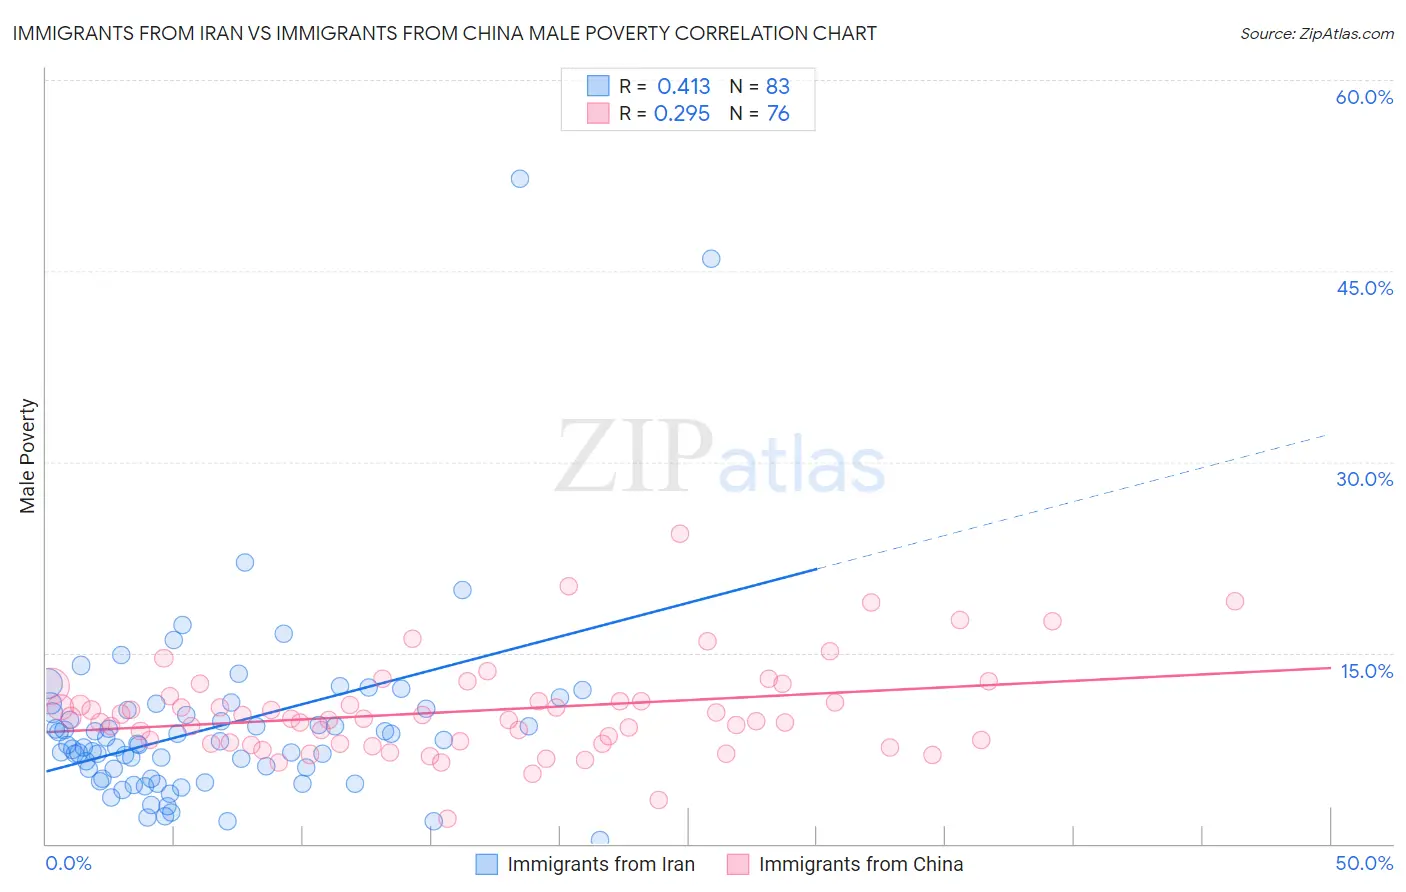
Immigrants from Iran vs Immigrants from China Male Poverty Correlation Chart
The statistical analysis conducted on geographies consisting of 279,773,882 people shows a moderate positive correlation between the proportion of Immigrants from Iran and poverty level among males in the United States with a correlation coefficient (R) of 0.413 and weighted average of 9.9%. Similarly, the statistical analysis conducted on geographies consisting of 456,181,421 people shows a weak positive correlation between the proportion of Immigrants from China and poverty level among males in the United States with a correlation coefficient (R) of 0.295 and weighted average of 10.7%, a difference of 7.7%.
Male Poverty Correlation Summary
| Measurement | Immigrants from Iran | Immigrants from China |
| Minimum | 0.33% | 1.9% |
| Maximum | 52.3% | 24.3% |
| Range | 51.9% | 22.4% |
| Mean | 9.2% | 10.4% |
| Median | 7.8% | 9.8% |
| Interquartile 25% (IQ1) | 5.1% | 7.9% |
| Interquartile 75% (IQ3) | 10.5% | 11.4% |
| Interquartile Range (IQR) | 5.4% | 3.4% |
| Standard Deviation (Sample) | 7.5% | 3.7% |
| Standard Deviation (Population) | 7.4% | 3.7% |
Similar Demographics by Male Poverty
Demographics Similar to Immigrants from Iran by Male Poverty
In terms of male poverty, the demographic groups most similar to Immigrants from Iran are Korean (9.9%, a difference of 0.24%), Immigrants from Moldova (9.9%, a difference of 0.26%), Cypriot (9.9%, a difference of 0.34%), Immigrants from Pakistan (9.9%, a difference of 0.42%), and Russian (9.9%, a difference of 0.42%).
| Demographics | Rating | Rank | Male Poverty |
| Iranians | 99.4 /100 | #35 | Exceptional 9.8% |
| Czechs | 99.4 /100 | #36 | Exceptional 9.8% |
| Immigrants | Greece | 99.3 /100 | #37 | Exceptional 9.8% |
| Immigrants | Pakistan | 99.2 /100 | #38 | Exceptional 9.9% |
| Russians | 99.2 /100 | #39 | Exceptional 9.9% |
| Cypriots | 99.2 /100 | #40 | Exceptional 9.9% |
| Koreans | 99.2 /100 | #41 | Exceptional 9.9% |
| Immigrants | Iran | 99.1 /100 | #42 | Exceptional 9.9% |
| Immigrants | Moldova | 99.0 /100 | #43 | Exceptional 9.9% |
| Immigrants | Romania | 98.9 /100 | #44 | Exceptional 9.9% |
| Immigrants | Serbia | 98.9 /100 | #45 | Exceptional 10.0% |
| Turks | 98.9 /100 | #46 | Exceptional 10.0% |
| Immigrants | Singapore | 98.8 /100 | #47 | Exceptional 10.0% |
| Immigrants | Japan | 98.8 /100 | #48 | Exceptional 10.0% |
| Slovenes | 98.8 /100 | #49 | Exceptional 10.0% |
Demographics Similar to Immigrants from China by Male Poverty
In terms of male poverty, the demographic groups most similar to Immigrants from China are Peruvian (10.7%, a difference of 0.010%), Native Hawaiian (10.7%, a difference of 0.030%), South African (10.7%, a difference of 0.070%), Immigrants from Hungary (10.7%, a difference of 0.10%), and French (10.7%, a difference of 0.10%).
| Demographics | Rating | Rank | Male Poverty |
| Palestinians | 89.1 /100 | #113 | Excellent 10.6% |
| Immigrants | Brazil | 89.0 /100 | #114 | Excellent 10.6% |
| Immigrants | Russia | 88.6 /100 | #115 | Excellent 10.6% |
| Sri Lankans | 88.1 /100 | #116 | Excellent 10.6% |
| Immigrants | South Eastern Asia | 88.1 /100 | #117 | Excellent 10.6% |
| Okinawans | 87.6 /100 | #118 | Excellent 10.7% |
| Immigrants | Hungary | 87.6 /100 | #119 | Excellent 10.7% |
| Immigrants | China | 87.1 /100 | #120 | Excellent 10.7% |
| Peruvians | 87.1 /100 | #121 | Excellent 10.7% |
| Native Hawaiians | 87.0 /100 | #122 | Excellent 10.7% |
| South Africans | 86.8 /100 | #123 | Excellent 10.7% |
| French | 86.7 /100 | #124 | Excellent 10.7% |
| Immigrants | Norway | 86.0 /100 | #125 | Excellent 10.7% |
| Immigrants | Ukraine | 84.3 /100 | #126 | Excellent 10.7% |
| Puget Sound Salish | 84.3 /100 | #127 | Excellent 10.7% |