Immigrants from Iran vs Apache In Labor Force | Age 35-44
COMPARE
Immigrants from Iran
Apache
In Labor Force | Age 35-44
In Labor Force | Age 35-44 Comparison
Immigrants from Iran
Apache
84.4%
IN LABOR FORCE | AGE 35-44
50.0/ 100
METRIC RATING
174th/ 347
METRIC RANK
77.9%
IN LABOR FORCE | AGE 35-44
0.0/ 100
METRIC RATING
337th/ 347
METRIC RANK
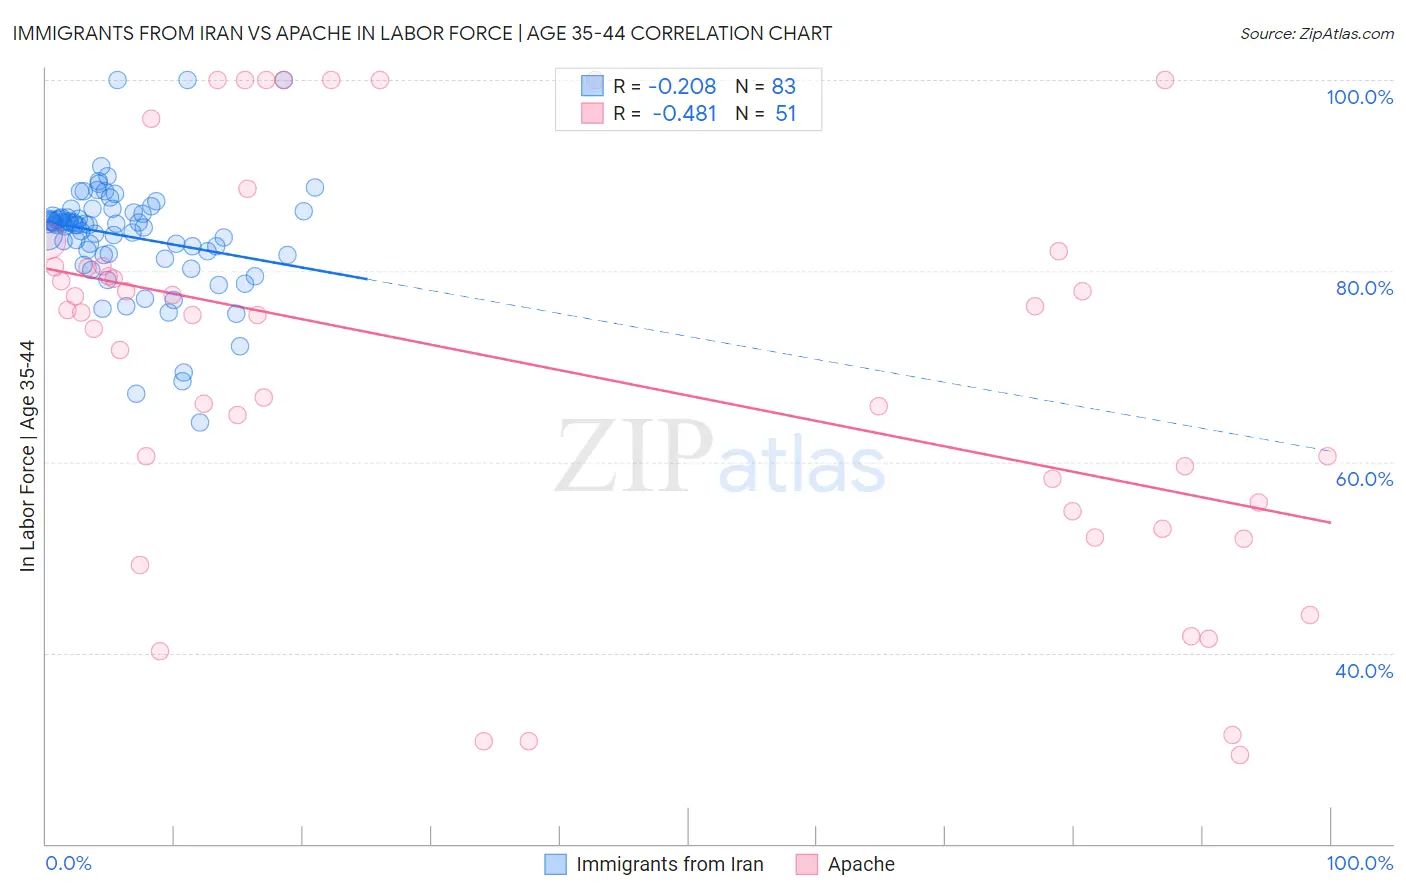
Immigrants from Iran vs Apache In Labor Force | Age 35-44 Correlation Chart
The statistical analysis conducted on geographies consisting of 279,863,653 people shows a weak negative correlation between the proportion of Immigrants from Iran and labor force participation rate among population between the ages 35 and 44 in the United States with a correlation coefficient (R) of -0.208 and weighted average of 84.4%. Similarly, the statistical analysis conducted on geographies consisting of 231,077,330 people shows a moderate negative correlation between the proportion of Apache and labor force participation rate among population between the ages 35 and 44 in the United States with a correlation coefficient (R) of -0.481 and weighted average of 77.9%, a difference of 8.3%.
In Labor Force | Age 35-44 Correlation Summary
| Measurement | Immigrants from Iran | Apache |
| Minimum | 64.1% | 29.3% |
| Maximum | 100.0% | 100.0% |
| Range | 35.9% | 70.7% |
| Mean | 83.7% | 70.1% |
| Median | 84.9% | 75.4% |
| Interquartile 25% (IQ1) | 81.7% | 54.8% |
| Interquartile 75% (IQ3) | 86.1% | 80.5% |
| Interquartile Range (IQR) | 4.4% | 25.7% |
| Standard Deviation (Sample) | 6.0% | 20.6% |
| Standard Deviation (Population) | 5.9% | 20.4% |
Similar Demographics by In Labor Force | Age 35-44
Demographics Similar to Immigrants from Iran by In Labor Force | Age 35-44
In terms of in labor force | age 35-44, the demographic groups most similar to Immigrants from Iran are Immigrants from Trinidad and Tobago (84.4%, a difference of 0.0%), Jordanian (84.4%, a difference of 0.010%), Scandinavian (84.4%, a difference of 0.010%), Pakistani (84.4%, a difference of 0.010%), and Irish (84.4%, a difference of 0.020%).
| Demographics | Rating | Rank | In Labor Force | Age 35-44 |
| Immigrants | Portugal | 55.2 /100 | #167 | Average 84.4% |
| Irish | 53.1 /100 | #168 | Average 84.4% |
| Immigrants | Afghanistan | 52.7 /100 | #169 | Average 84.4% |
| Immigrants | Jordan | 52.5 /100 | #170 | Average 84.4% |
| Jordanians | 51.7 /100 | #171 | Average 84.4% |
| Scandinavians | 51.2 /100 | #172 | Average 84.4% |
| Immigrants | Trinidad and Tobago | 50.7 /100 | #173 | Average 84.4% |
| Immigrants | Iran | 50.0 /100 | #174 | Average 84.4% |
| Pakistanis | 48.2 /100 | #175 | Average 84.4% |
| Sri Lankans | 47.3 /100 | #176 | Average 84.4% |
| French Canadians | 44.3 /100 | #177 | Average 84.3% |
| Northern Europeans | 44.1 /100 | #178 | Average 84.3% |
| Immigrants | South Africa | 42.8 /100 | #179 | Average 84.3% |
| Danes | 38.8 /100 | #180 | Fair 84.3% |
| Immigrants | West Indies | 36.4 /100 | #181 | Fair 84.3% |
Demographics Similar to Apache by In Labor Force | Age 35-44
In terms of in labor force | age 35-44, the demographic groups most similar to Apache are Arapaho (78.1%, a difference of 0.21%), Pueblo (77.4%, a difference of 0.70%), Yup'ik (77.3%, a difference of 0.81%), Lumbee (77.0%, a difference of 1.2%), and Hopi (77.0%, a difference of 1.2%).
| Demographics | Rating | Rank | In Labor Force | Age 35-44 |
| Cheyenne | 0.0 /100 | #330 | Tragic 79.5% |
| Houma | 0.0 /100 | #331 | Tragic 79.5% |
| Ute | 0.0 /100 | #332 | Tragic 79.4% |
| Kiowa | 0.0 /100 | #333 | Tragic 79.2% |
| Yakama | 0.0 /100 | #334 | Tragic 79.0% |
| Natives/Alaskans | 0.0 /100 | #335 | Tragic 78.9% |
| Arapaho | 0.0 /100 | #336 | Tragic 78.1% |
| Apache | 0.0 /100 | #337 | Tragic 77.9% |
| Pueblo | 0.0 /100 | #338 | Tragic 77.4% |
| Yup'ik | 0.0 /100 | #339 | Tragic 77.3% |
| Lumbee | 0.0 /100 | #340 | Tragic 77.0% |
| Hopi | 0.0 /100 | #341 | Tragic 77.0% |
| Crow | 0.0 /100 | #342 | Tragic 76.5% |
| Immigrants | Yemen | 0.0 /100 | #343 | Tragic 76.3% |
| Pima | 0.0 /100 | #344 | Tragic 74.8% |