Immigrants from Hungary vs Apache Child Poverty Among Girls Under 16
COMPARE
Immigrants from Hungary
Apache
Child Poverty Among Girls Under 16
Child Poverty Among Girls Under 16 Comparison
Immigrants from Hungary
Apache
15.8%
CHILD POVERTY AMONG GIRLS UNDER 16
80.9/ 100
METRIC RATING
149th/ 347
METRIC RANK
23.8%
CHILD POVERTY AMONG GIRLS UNDER 16
0.0/ 100
METRIC RATING
331st/ 347
METRIC RANK
Immigrants from Hungary vs Apache Child Poverty Among Girls Under 16 Correlation Chart
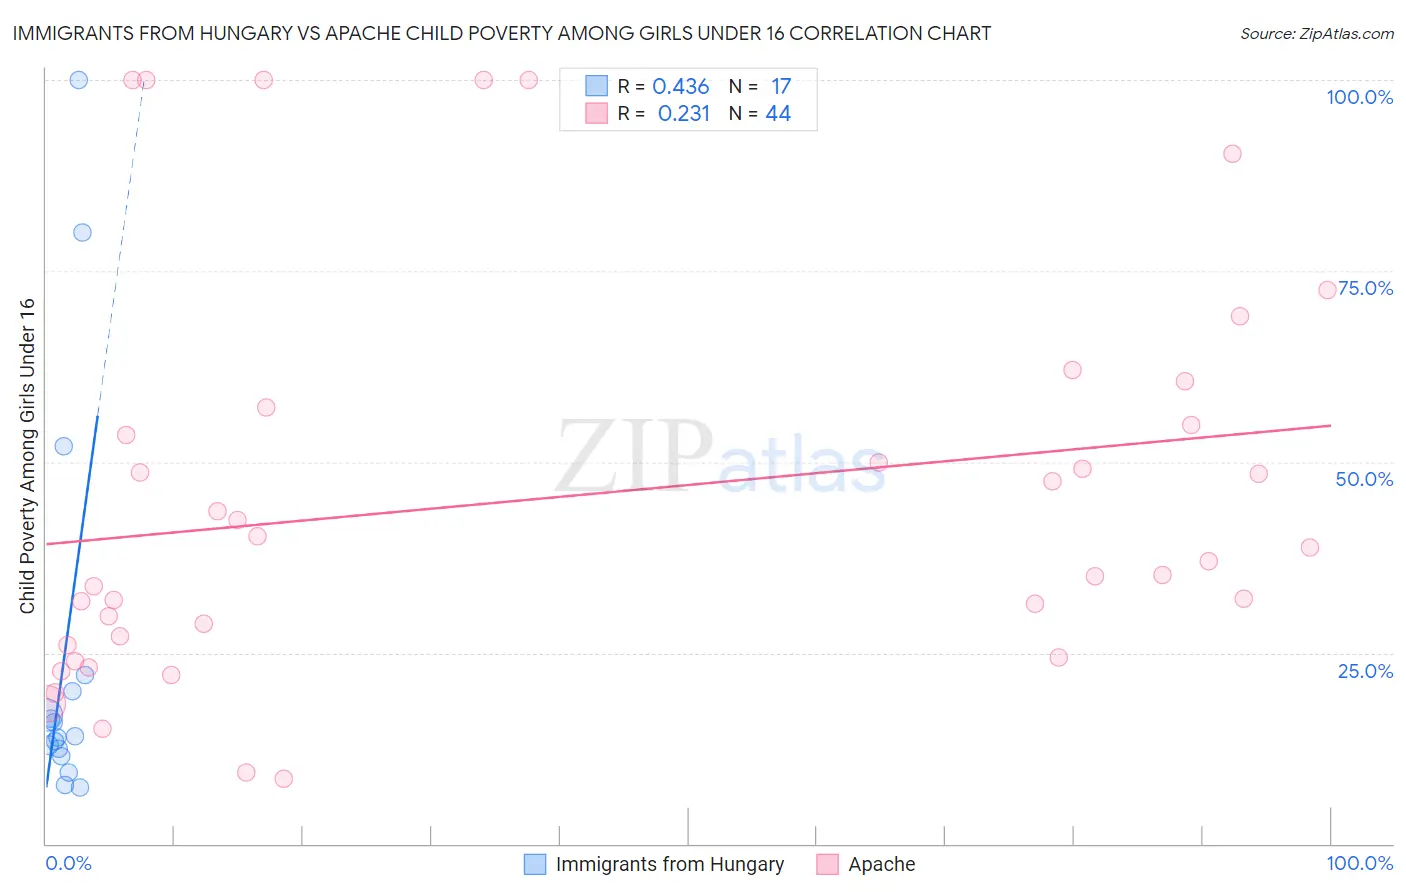
The statistical analysis conducted on geographies consisting of 193,307,039 people shows a moderate positive correlation between the proportion of Immigrants from Hungary and poverty level among girls under the age of 16 in the United States with a correlation coefficient (R) of 0.436 and weighted average of 15.8%. Similarly, the statistical analysis conducted on geographies consisting of 229,644,906 people shows a weak positive correlation between the proportion of Apache and poverty level among girls under the age of 16 in the United States with a correlation coefficient (R) of 0.231 and weighted average of 23.8%, a difference of 51.0%.
Child Poverty Among Girls Under 16 Correlation Summary
| Measurement | Immigrants from Hungary | Apache |
| Minimum | 7.3% | 8.5% |
| Maximum | 100.0% | 100.0% |
| Range | 92.7% | 91.5% |
| Mean | 25.0% | 45.4% |
| Median | 14.0% | 37.9% |
| Interquartile 25% (IQ1) | 12.0% | 26.6% |
| Interquartile 75% (IQ3) | 21.1% | 56.0% |
| Interquartile Range (IQR) | 9.1% | 29.4% |
| Standard Deviation (Sample) | 26.6% | 26.0% |
| Standard Deviation (Population) | 25.9% | 25.7% |
Similar Demographics by Child Poverty Among Girls Under 16
Demographics Similar to Immigrants from Hungary by Child Poverty Among Girls Under 16
In terms of child poverty among girls under 16, the demographic groups most similar to Immigrants from Hungary are Immigrants from Albania (15.8%, a difference of 0.040%), Venezuelan (15.8%, a difference of 0.14%), Immigrants from Kuwait (15.8%, a difference of 0.28%), Icelander (15.7%, a difference of 0.32%), and Immigrants from Nepal (15.9%, a difference of 0.44%).
| Demographics | Rating | Rank | Child Poverty Among Girls Under 16 |
| Canadians | 87.1 /100 | #142 | Excellent 15.6% |
| Immigrants | Peru | 86.6 /100 | #143 | Excellent 15.6% |
| Israelis | 86.3 /100 | #144 | Excellent 15.6% |
| Welsh | 85.4 /100 | #145 | Excellent 15.6% |
| Samoans | 84.2 /100 | #146 | Excellent 15.7% |
| Slavs | 83.1 /100 | #147 | Excellent 15.7% |
| Icelanders | 82.4 /100 | #148 | Excellent 15.7% |
| Immigrants | Hungary | 80.9 /100 | #149 | Excellent 15.8% |
| Immigrants | Albania | 80.7 /100 | #150 | Excellent 15.8% |
| Venezuelans | 80.1 /100 | #151 | Excellent 15.8% |
| Immigrants | Kuwait | 79.4 /100 | #152 | Good 15.8% |
| Immigrants | Nepal | 78.5 /100 | #153 | Good 15.9% |
| Immigrants | Chile | 76.7 /100 | #154 | Good 15.9% |
| Syrians | 76.7 /100 | #155 | Good 15.9% |
| Immigrants | Fiji | 76.1 /100 | #156 | Good 15.9% |
Demographics Similar to Apache by Child Poverty Among Girls Under 16
In terms of child poverty among girls under 16, the demographic groups most similar to Apache are Immigrants from Dominican Republic (23.8%, a difference of 0.050%), Kiowa (23.7%, a difference of 0.58%), Dominican (23.7%, a difference of 0.70%), Native/Alaskan (24.0%, a difference of 0.86%), and Black/African American (24.7%, a difference of 3.4%).
| Demographics | Rating | Rank | Child Poverty Among Girls Under 16 |
| Paiute | 0.0 /100 | #324 | Tragic 22.6% |
| Immigrants | Congo | 0.0 /100 | #325 | Tragic 22.7% |
| Immigrants | Honduras | 0.0 /100 | #326 | Tragic 22.8% |
| Central American Indians | 0.0 /100 | #327 | Tragic 22.8% |
| Dominicans | 0.0 /100 | #328 | Tragic 23.7% |
| Kiowa | 0.0 /100 | #329 | Tragic 23.7% |
| Immigrants | Dominican Republic | 0.0 /100 | #330 | Tragic 23.8% |
| Apache | 0.0 /100 | #331 | Tragic 23.8% |
| Natives/Alaskans | 0.0 /100 | #332 | Tragic 24.0% |
| Blacks/African Americans | 0.0 /100 | #333 | Tragic 24.7% |
| Menominee | 0.0 /100 | #334 | Tragic 25.0% |
| Pueblo | 0.0 /100 | #335 | Tragic 25.2% |
| Sioux | 0.0 /100 | #336 | Tragic 25.6% |
| Yup'ik | 0.0 /100 | #337 | Tragic 25.8% |
| Cheyenne | 0.0 /100 | #338 | Tragic 26.3% |