Immigrants from Hungary vs Puget Sound Salish Child Poverty Among Girls Under 16
COMPARE
Immigrants from Hungary
Puget Sound Salish
Child Poverty Among Girls Under 16
Child Poverty Among Girls Under 16 Comparison
Immigrants from Hungary
Puget Sound Salish
15.8%
CHILD POVERTY AMONG GIRLS UNDER 16
80.9/ 100
METRIC RATING
149th/ 347
METRIC RANK
15.4%
CHILD POVERTY AMONG GIRLS UNDER 16
90.1/ 100
METRIC RATING
130th/ 347
METRIC RANK
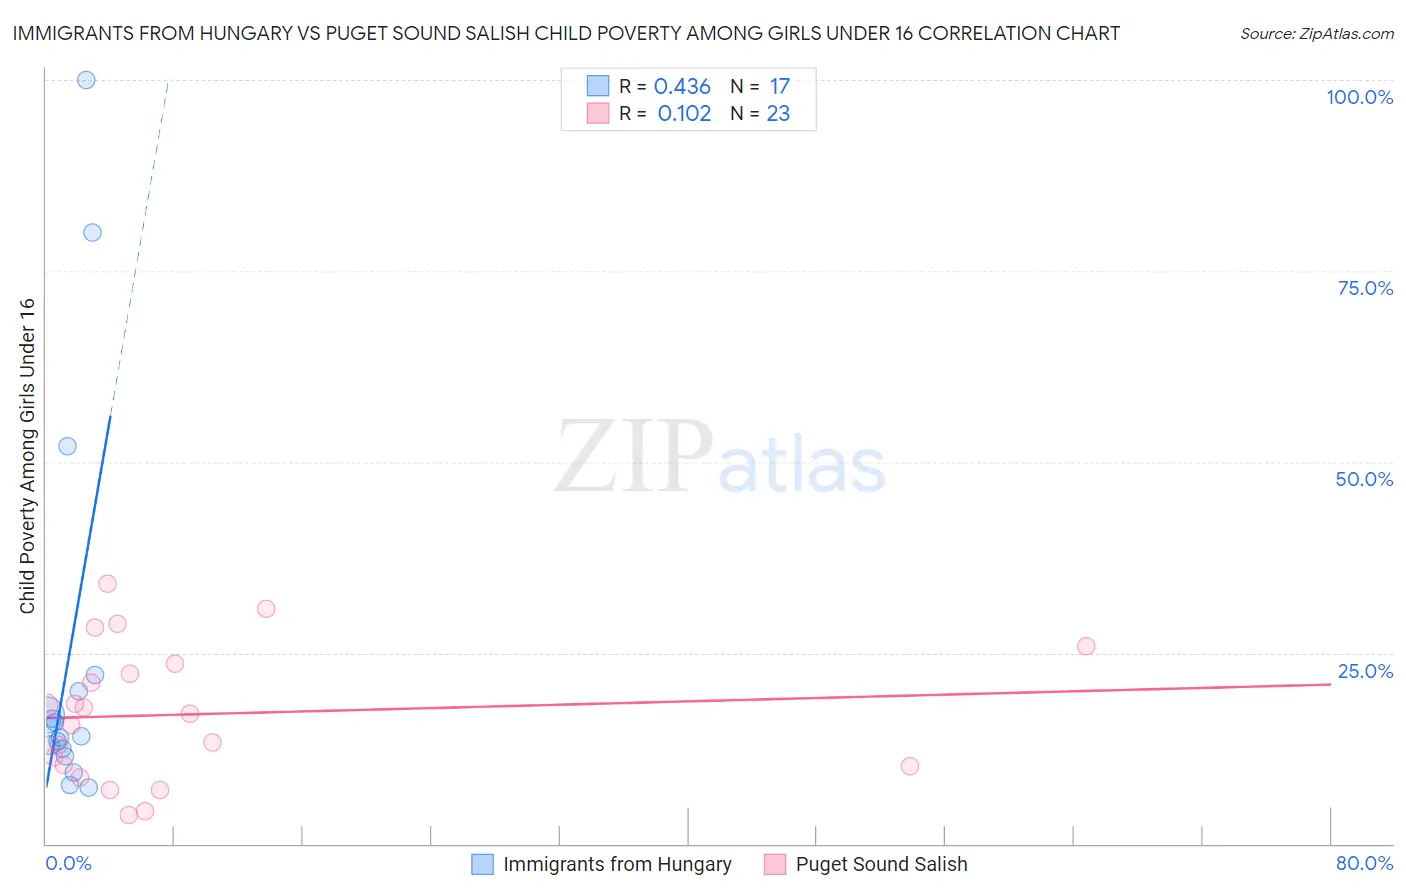
Immigrants from Hungary vs Puget Sound Salish Child Poverty Among Girls Under 16 Correlation Chart
The statistical analysis conducted on geographies consisting of 193,307,039 people shows a moderate positive correlation between the proportion of Immigrants from Hungary and poverty level among girls under the age of 16 in the United States with a correlation coefficient (R) of 0.436 and weighted average of 15.8%. Similarly, the statistical analysis conducted on geographies consisting of 45,926,658 people shows a poor positive correlation between the proportion of Puget Sound Salish and poverty level among girls under the age of 16 in the United States with a correlation coefficient (R) of 0.102 and weighted average of 15.4%, a difference of 2.3%.
Child Poverty Among Girls Under 16 Correlation Summary
| Measurement | Immigrants from Hungary | Puget Sound Salish |
| Minimum | 7.3% | 3.7% |
| Maximum | 100.0% | 34.1% |
| Range | 92.7% | 30.4% |
| Mean | 25.0% | 17.0% |
| Median | 14.0% | 17.0% |
| Interquartile 25% (IQ1) | 12.0% | 10.2% |
| Interquartile 75% (IQ3) | 21.1% | 23.5% |
| Interquartile Range (IQR) | 9.1% | 13.3% |
| Standard Deviation (Sample) | 26.6% | 8.7% |
| Standard Deviation (Population) | 25.9% | 8.5% |
Demographics Similar to Immigrants from Hungary and Puget Sound Salish by Child Poverty Among Girls Under 16
In terms of child poverty among girls under 16, the demographic groups most similar to Immigrants from Hungary are Icelander (15.7%, a difference of 0.32%), Slavic (15.7%, a difference of 0.46%), Samoan (15.7%, a difference of 0.70%), Welsh (15.6%, a difference of 0.99%), and Israeli (15.6%, a difference of 1.2%). Similarly, the demographic groups most similar to Puget Sound Salish are Immigrants from Western Europe (15.4%, a difference of 0.020%), Mongolian (15.4%, a difference of 0.13%), Brazilian (15.4%, a difference of 0.15%), Immigrants from South Eastern Asia (15.4%, a difference of 0.16%), and Immigrants from Spain (15.5%, a difference of 0.30%).
| Demographics | Rating | Rank | Child Poverty Among Girls Under 16 |
| Immigrants | South Eastern Asia | 90.5 /100 | #129 | Exceptional 15.4% |
| Puget Sound Salish | 90.1 /100 | #130 | Exceptional 15.4% |
| Immigrants | Western Europe | 90.0 /100 | #131 | Exceptional 15.4% |
| Mongolians | 89.7 /100 | #132 | Excellent 15.4% |
| Brazilians | 89.6 /100 | #133 | Excellent 15.4% |
| Immigrants | Spain | 89.1 /100 | #134 | Excellent 15.5% |
| Czechoslovakians | 89.0 /100 | #135 | Excellent 15.5% |
| Native Hawaiians | 89.0 /100 | #136 | Excellent 15.5% |
| South Africans | 88.7 /100 | #137 | Excellent 15.5% |
| Immigrants | Vietnam | 88.2 /100 | #138 | Excellent 15.5% |
| Armenians | 87.9 /100 | #139 | Excellent 15.5% |
| New Zealanders | 87.2 /100 | #140 | Excellent 15.6% |
| Immigrants | Jordan | 87.2 /100 | #141 | Excellent 15.6% |
| Canadians | 87.1 /100 | #142 | Excellent 15.6% |
| Immigrants | Peru | 86.6 /100 | #143 | Excellent 15.6% |
| Israelis | 86.3 /100 | #144 | Excellent 15.6% |
| Welsh | 85.4 /100 | #145 | Excellent 15.6% |
| Samoans | 84.2 /100 | #146 | Excellent 15.7% |
| Slavs | 83.1 /100 | #147 | Excellent 15.7% |
| Icelanders | 82.4 /100 | #148 | Excellent 15.7% |
| Immigrants | Hungary | 80.9 /100 | #149 | Excellent 15.8% |