Immigrants from Hungary vs Ethiopian Child Poverty Among Girls Under 16
COMPARE
Immigrants from Hungary
Ethiopian
Child Poverty Among Girls Under 16
Child Poverty Among Girls Under 16 Comparison
Immigrants from Hungary
Ethiopians
15.8%
CHILD POVERTY AMONG GIRLS UNDER 16
80.9/ 100
METRIC RATING
149th/ 347
METRIC RANK
16.5%
CHILD POVERTY AMONG GIRLS UNDER 16
50.0/ 100
METRIC RATING
174th/ 347
METRIC RANK
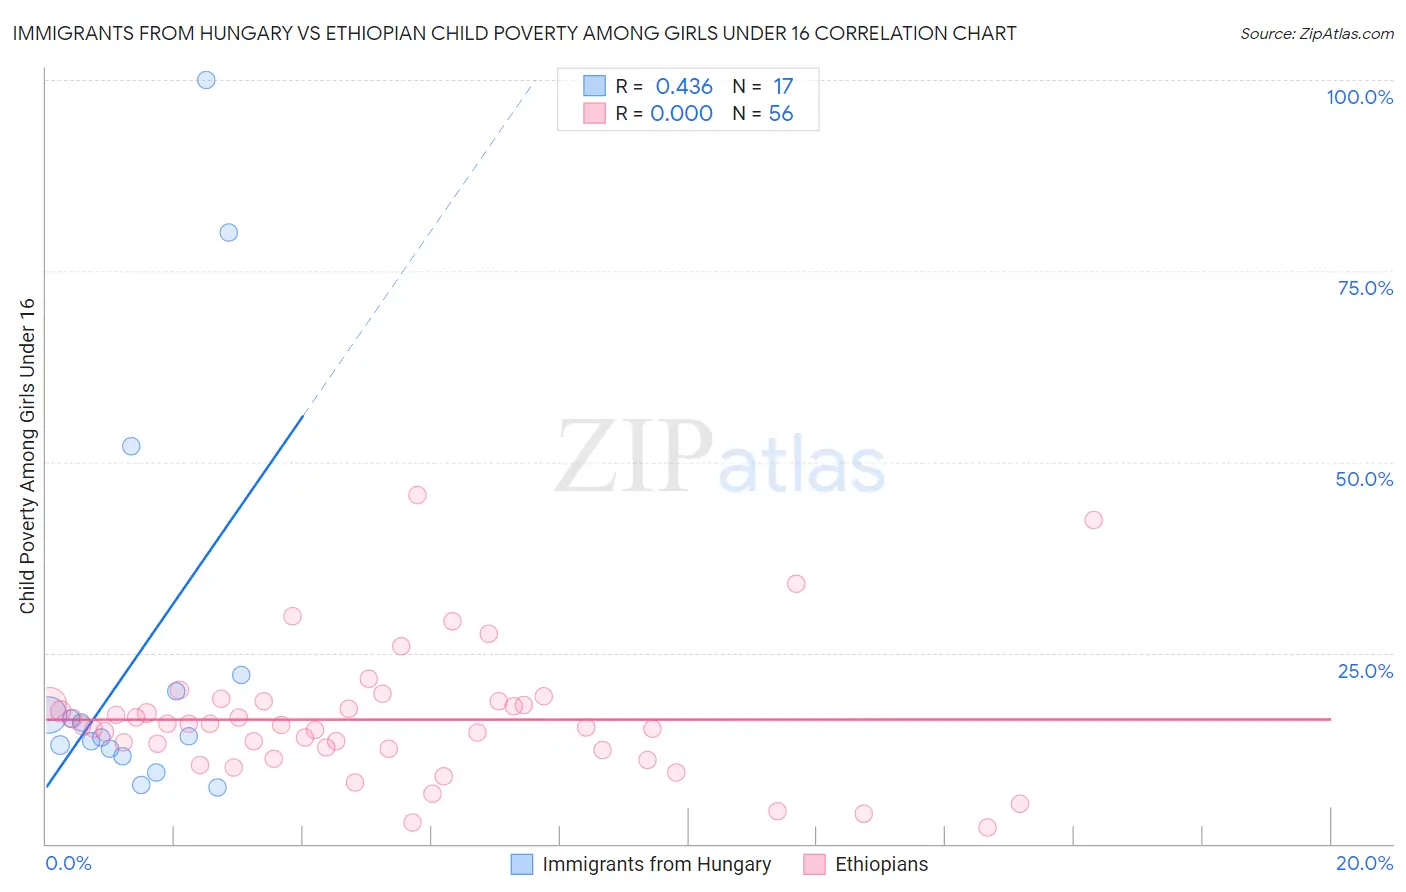
Immigrants from Hungary vs Ethiopian Child Poverty Among Girls Under 16 Correlation Chart
The statistical analysis conducted on geographies consisting of 193,307,039 people shows a moderate positive correlation between the proportion of Immigrants from Hungary and poverty level among girls under the age of 16 in the United States with a correlation coefficient (R) of 0.436 and weighted average of 15.8%. Similarly, the statistical analysis conducted on geographies consisting of 221,230,982 people shows no correlation between the proportion of Ethiopians and poverty level among girls under the age of 16 in the United States with a correlation coefficient (R) of 0.000 and weighted average of 16.5%, a difference of 4.3%.
Child Poverty Among Girls Under 16 Correlation Summary
| Measurement | Immigrants from Hungary | Ethiopian |
| Minimum | 7.3% | 2.1% |
| Maximum | 100.0% | 45.6% |
| Range | 92.7% | 43.5% |
| Mean | 25.0% | 16.3% |
| Median | 14.0% | 15.5% |
| Interquartile 25% (IQ1) | 12.0% | 12.3% |
| Interquartile 75% (IQ3) | 21.1% | 18.5% |
| Interquartile Range (IQR) | 9.1% | 6.1% |
| Standard Deviation (Sample) | 26.6% | 8.3% |
| Standard Deviation (Population) | 25.9% | 8.3% |
Similar Demographics by Child Poverty Among Girls Under 16
Demographics Similar to Immigrants from Hungary by Child Poverty Among Girls Under 16
In terms of child poverty among girls under 16, the demographic groups most similar to Immigrants from Hungary are Immigrants from Albania (15.8%, a difference of 0.040%), Venezuelan (15.8%, a difference of 0.14%), Immigrants from Kuwait (15.8%, a difference of 0.28%), Icelander (15.7%, a difference of 0.32%), and Immigrants from Nepal (15.9%, a difference of 0.44%).
| Demographics | Rating | Rank | Child Poverty Among Girls Under 16 |
| Canadians | 87.1 /100 | #142 | Excellent 15.6% |
| Immigrants | Peru | 86.6 /100 | #143 | Excellent 15.6% |
| Israelis | 86.3 /100 | #144 | Excellent 15.6% |
| Welsh | 85.4 /100 | #145 | Excellent 15.6% |
| Samoans | 84.2 /100 | #146 | Excellent 15.7% |
| Slavs | 83.1 /100 | #147 | Excellent 15.7% |
| Icelanders | 82.4 /100 | #148 | Excellent 15.7% |
| Immigrants | Hungary | 80.9 /100 | #149 | Excellent 15.8% |
| Immigrants | Albania | 80.7 /100 | #150 | Excellent 15.8% |
| Venezuelans | 80.1 /100 | #151 | Excellent 15.8% |
| Immigrants | Kuwait | 79.4 /100 | #152 | Good 15.8% |
| Immigrants | Nepal | 78.5 /100 | #153 | Good 15.9% |
| Immigrants | Chile | 76.7 /100 | #154 | Good 15.9% |
| Syrians | 76.7 /100 | #155 | Good 15.9% |
| Immigrants | Fiji | 76.1 /100 | #156 | Good 15.9% |
Demographics Similar to Ethiopians by Child Poverty Among Girls Under 16
In terms of child poverty among girls under 16, the demographic groups most similar to Ethiopians are Lebanese (16.6%, a difference of 0.53%), Hungarian (16.6%, a difference of 0.56%), Immigrants from South America (16.4%, a difference of 0.59%), Immigrants from Western Asia (16.6%, a difference of 0.68%), and White/Caucasian (16.6%, a difference of 0.73%).
| Demographics | Rating | Rank | Child Poverty Among Girls Under 16 |
| Uruguayans | 64.7 /100 | #167 | Good 16.2% |
| Yugoslavians | 64.4 /100 | #168 | Good 16.2% |
| Costa Ricans | 64.2 /100 | #169 | Good 16.2% |
| Immigrants | Venezuela | 64.2 /100 | #170 | Good 16.2% |
| Immigrants | Saudi Arabia | 64.0 /100 | #171 | Good 16.2% |
| Afghans | 62.3 /100 | #172 | Good 16.2% |
| Immigrants | South America | 55.1 /100 | #173 | Average 16.4% |
| Ethiopians | 50.0 /100 | #174 | Average 16.5% |
| Lebanese | 45.4 /100 | #175 | Average 16.6% |
| Hungarians | 45.1 /100 | #176 | Average 16.6% |
| Immigrants | Western Asia | 44.1 /100 | #177 | Average 16.6% |
| Whites/Caucasians | 43.6 /100 | #178 | Average 16.6% |
| Hawaiians | 43.4 /100 | #179 | Average 16.6% |
| Immigrants | Syria | 43.3 /100 | #180 | Average 16.6% |
| Immigrants | Iraq | 43.2 /100 | #181 | Average 16.6% |