Immigrants from Ethiopia vs Immigrants from Iraq Married-Couple Family Poverty
COMPARE
Immigrants from Ethiopia
Immigrants from Iraq
Married-Couple Family Poverty
Married-Couple Family Poverty Comparison
Immigrants from Ethiopia
Immigrants from Iraq
5.1%
MARRIED-COUPLE FAMILY POVERTY
72.4/ 100
METRIC RATING
155th/ 347
METRIC RANK
5.7%
MARRIED-COUPLE FAMILY POVERTY
4.4/ 100
METRIC RATING
231st/ 347
METRIC RANK
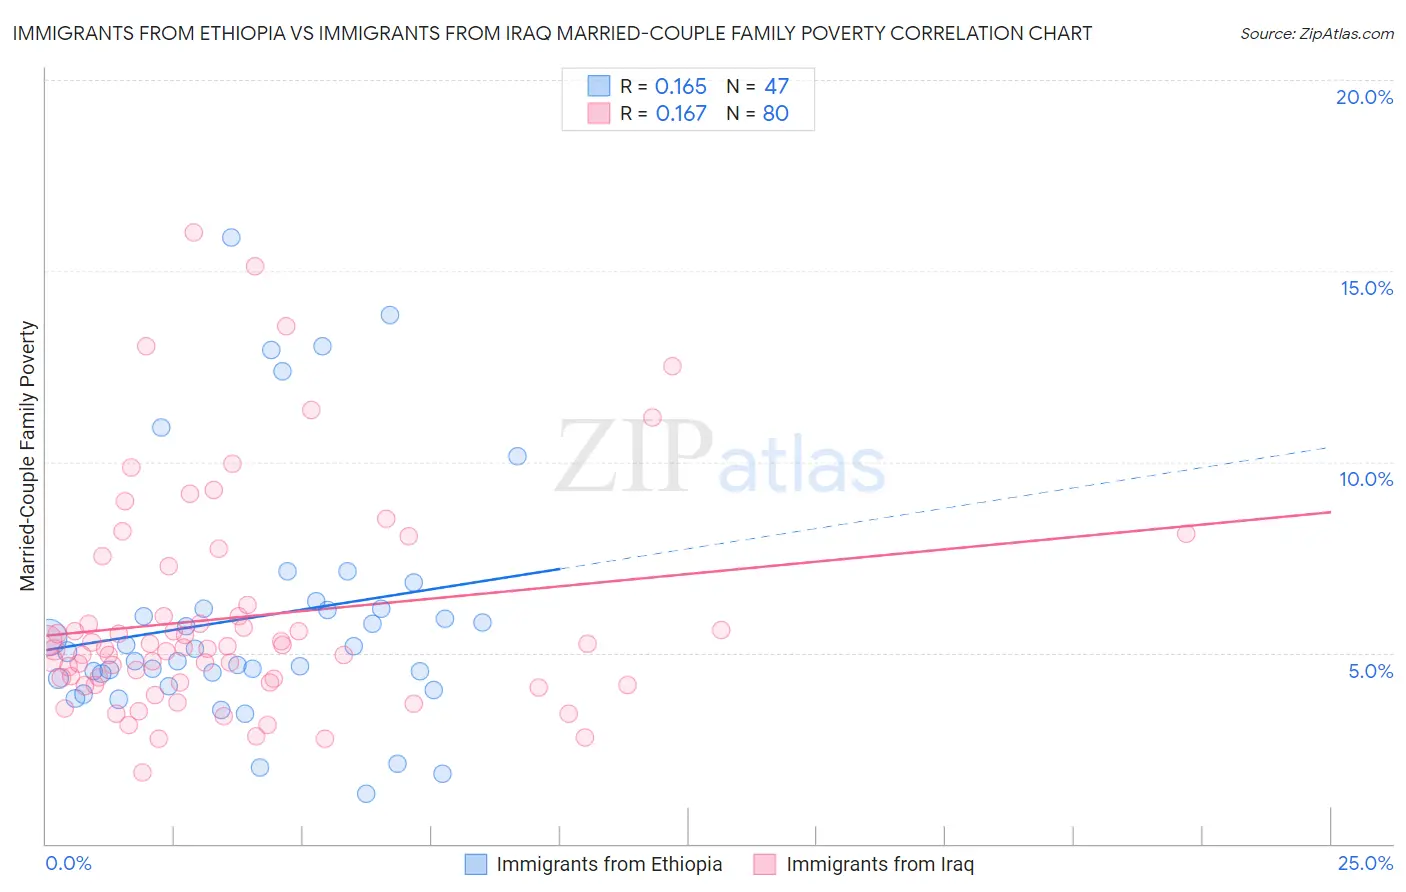
Immigrants from Ethiopia vs Immigrants from Iraq Married-Couple Family Poverty Correlation Chart
The statistical analysis conducted on geographies consisting of 210,673,890 people shows a poor positive correlation between the proportion of Immigrants from Ethiopia and poverty level among married-couple families in the United States with a correlation coefficient (R) of 0.165 and weighted average of 5.1%. Similarly, the statistical analysis conducted on geographies consisting of 194,160,466 people shows a poor positive correlation between the proportion of Immigrants from Iraq and poverty level among married-couple families in the United States with a correlation coefficient (R) of 0.167 and weighted average of 5.7%, a difference of 12.1%.
Married-Couple Family Poverty Correlation Summary
| Measurement | Immigrants from Ethiopia | Immigrants from Iraq |
| Minimum | 1.3% | 1.9% |
| Maximum | 15.9% | 16.0% |
| Range | 14.6% | 14.2% |
| Mean | 5.9% | 5.9% |
| Median | 5.0% | 5.1% |
| Interquartile 25% (IQ1) | 4.3% | 4.2% |
| Interquartile 75% (IQ3) | 6.2% | 6.1% |
| Interquartile Range (IQR) | 1.8% | 1.9% |
| Standard Deviation (Sample) | 3.2% | 2.9% |
| Standard Deviation (Population) | 3.2% | 2.9% |
Similar Demographics by Married-Couple Family Poverty
Demographics Similar to Immigrants from Ethiopia by Married-Couple Family Poverty
In terms of married-couple family poverty, the demographic groups most similar to Immigrants from Ethiopia are Sri Lankan (5.1%, a difference of 0.040%), Delaware (5.1%, a difference of 0.19%), Argentinean (5.1%, a difference of 0.26%), Immigrants from South Eastern Asia (5.1%, a difference of 0.31%), and Immigrants from Saudi Arabia (5.1%, a difference of 0.31%).
| Demographics | Rating | Rank | Married-Couple Family Poverty |
| Immigrants | Russia | 78.7 /100 | #148 | Good 5.0% |
| Immigrants | Oceania | 78.6 /100 | #149 | Good 5.0% |
| Brazilians | 78.3 /100 | #150 | Good 5.0% |
| Immigrants | Cameroon | 77.3 /100 | #151 | Good 5.0% |
| Albanians | 77.2 /100 | #152 | Good 5.0% |
| Immigrants | Kuwait | 76.3 /100 | #153 | Good 5.0% |
| Delaware | 73.7 /100 | #154 | Good 5.1% |
| Immigrants | Ethiopia | 72.4 /100 | #155 | Good 5.1% |
| Sri Lankans | 72.2 /100 | #156 | Good 5.1% |
| Argentineans | 70.7 /100 | #157 | Good 5.1% |
| Immigrants | South Eastern Asia | 70.4 /100 | #158 | Good 5.1% |
| Immigrants | Saudi Arabia | 70.3 /100 | #159 | Good 5.1% |
| Pennsylvania Germans | 68.5 /100 | #160 | Good 5.1% |
| Ethiopians | 68.1 /100 | #161 | Good 5.1% |
| Immigrants | Jordan | 66.5 /100 | #162 | Good 5.1% |
Demographics Similar to Immigrants from Iraq by Married-Couple Family Poverty
In terms of married-couple family poverty, the demographic groups most similar to Immigrants from Iraq are Immigrants from Laos (5.7%, a difference of 0.060%), Moroccan (5.7%, a difference of 0.26%), Subsaharan African (5.7%, a difference of 0.29%), Immigrants from Colombia (5.7%, a difference of 0.49%), and Immigrants from Uruguay (5.7%, a difference of 0.50%).
| Demographics | Rating | Rank | Married-Couple Family Poverty |
| Sudanese | 6.4 /100 | #224 | Tragic 5.6% |
| Immigrants | Cambodia | 6.1 /100 | #225 | Tragic 5.6% |
| South Americans | 5.7 /100 | #226 | Tragic 5.6% |
| Immigrants | Zaire | 5.6 /100 | #227 | Tragic 5.6% |
| Arabs | 5.4 /100 | #228 | Tragic 5.7% |
| Sub-Saharan Africans | 4.9 /100 | #229 | Tragic 5.7% |
| Moroccans | 4.9 /100 | #230 | Tragic 5.7% |
| Immigrants | Iraq | 4.4 /100 | #231 | Tragic 5.7% |
| Immigrants | Laos | 4.4 /100 | #232 | Tragic 5.7% |
| Immigrants | Colombia | 3.7 /100 | #233 | Tragic 5.7% |
| Immigrants | Uruguay | 3.7 /100 | #234 | Tragic 5.7% |
| Immigrants | Sudan | 3.5 /100 | #235 | Tragic 5.7% |
| Ghanaians | 3.3 /100 | #236 | Tragic 5.7% |
| Immigrants | South America | 3.1 /100 | #237 | Tragic 5.7% |
| Cherokee | 2.7 /100 | #238 | Tragic 5.8% |