Immigrants from England vs Apache Child Poverty Under the Age of 5
COMPARE
Immigrants from England
Apache
Child Poverty Under the Age of 5
Child Poverty Under the Age of 5 Comparison
Immigrants from England
Apache
16.2%
CHILD POVERTY UNDER THE AGE OF 5
91.5/ 100
METRIC RATING
127th/ 347
METRIC RANK
25.0%
CHILD POVERTY UNDER THE AGE OF 5
0.0/ 100
METRIC RATING
332nd/ 347
METRIC RANK
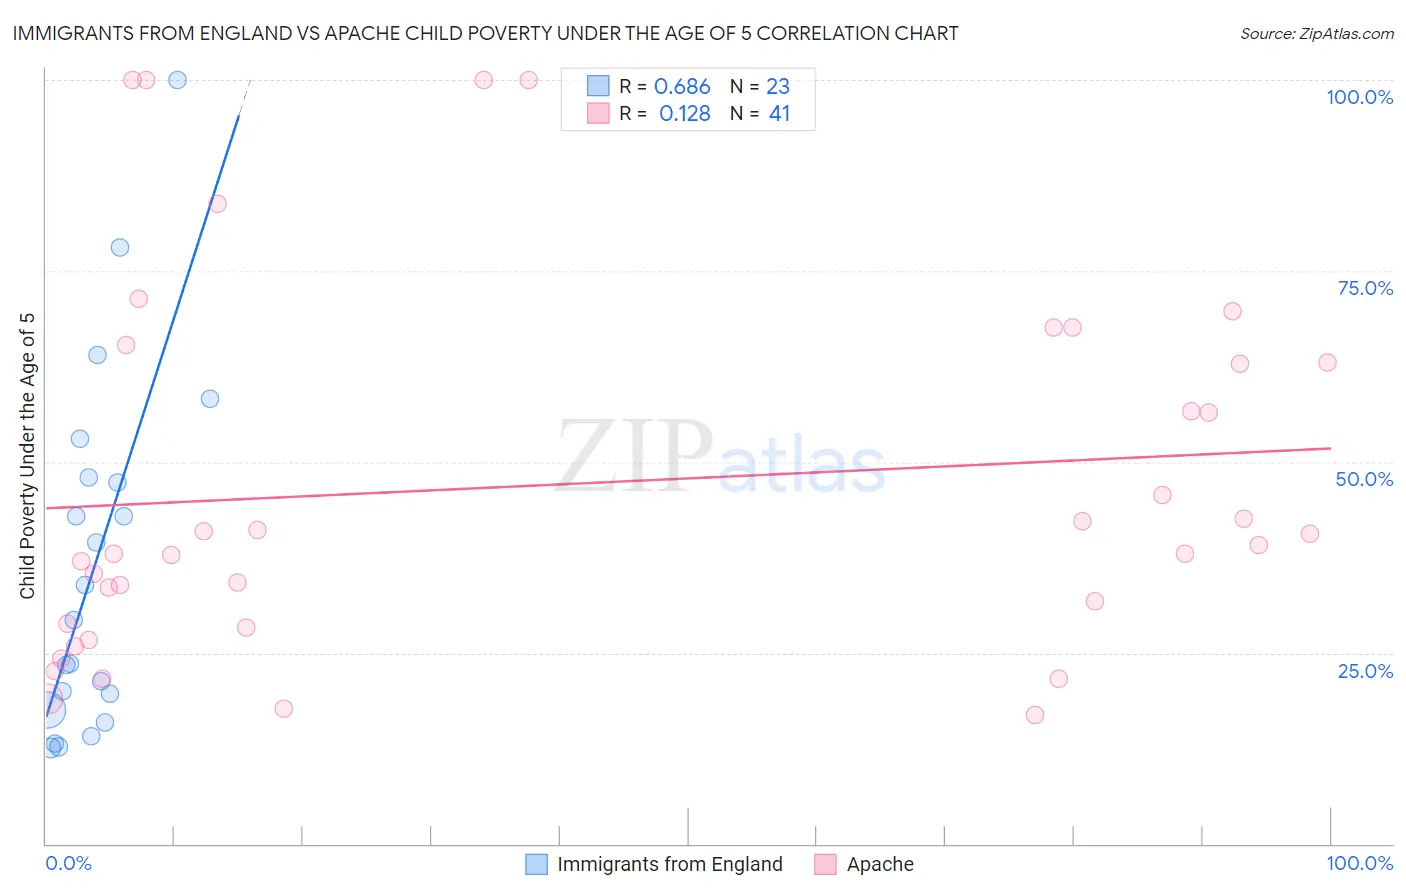
Immigrants from England vs Apache Child Poverty Under the Age of 5 Correlation Chart
The statistical analysis conducted on geographies consisting of 373,543,050 people shows a significant positive correlation between the proportion of Immigrants from England and poverty level among children under the age of 5 in the United States with a correlation coefficient (R) of 0.686 and weighted average of 16.2%. Similarly, the statistical analysis conducted on geographies consisting of 227,703,796 people shows a poor positive correlation between the proportion of Apache and poverty level among children under the age of 5 in the United States with a correlation coefficient (R) of 0.128 and weighted average of 25.0%, a difference of 54.6%.
Child Poverty Under the Age of 5 Correlation Summary
| Measurement | Immigrants from England | Apache |
| Minimum | 12.5% | 16.9% |
| Maximum | 100.0% | 100.0% |
| Range | 87.5% | 83.1% |
| Mean | 36.1% | 47.1% |
| Median | 29.3% | 39.2% |
| Interquartile 25% (IQ1) | 17.6% | 28.6% |
| Interquartile 75% (IQ3) | 48.0% | 64.1% |
| Interquartile Range (IQR) | 30.5% | 35.5% |
| Standard Deviation (Sample) | 23.1% | 24.2% |
| Standard Deviation (Population) | 22.6% | 23.9% |
Similar Demographics by Child Poverty Under the Age of 5
Demographics Similar to Immigrants from England by Child Poverty Under the Age of 5
In terms of child poverty under the age of 5, the demographic groups most similar to Immigrants from England are Immigrants from Albania (16.2%, a difference of 0.080%), Native Hawaiian (16.2%, a difference of 0.090%), Swiss (16.1%, a difference of 0.16%), Austrian (16.1%, a difference of 0.17%), and Immigrants from Southern Europe (16.1%, a difference of 0.19%).
| Demographics | Rating | Rank | Child Poverty Under the Age of 5 |
| Immigrants | Peru | 92.6 /100 | #120 | Exceptional 16.1% |
| Mongolians | 92.5 /100 | #121 | Exceptional 16.1% |
| Immigrants | Southern Europe | 92.0 /100 | #122 | Exceptional 16.1% |
| Austrians | 92.0 /100 | #123 | Exceptional 16.1% |
| Swiss | 92.0 /100 | #124 | Exceptional 16.1% |
| Native Hawaiians | 91.8 /100 | #125 | Exceptional 16.2% |
| Immigrants | Albania | 91.8 /100 | #126 | Exceptional 16.2% |
| Immigrants | England | 91.5 /100 | #127 | Exceptional 16.2% |
| South Africans | 90.1 /100 | #128 | Exceptional 16.2% |
| British | 89.4 /100 | #129 | Excellent 16.3% |
| Immigrants | Norway | 89.3 /100 | #130 | Excellent 16.3% |
| Finns | 88.3 /100 | #131 | Excellent 16.3% |
| Serbians | 88.2 /100 | #132 | Excellent 16.3% |
| Icelanders | 87.9 /100 | #133 | Excellent 16.3% |
| Immigrants | North Macedonia | 87.8 /100 | #134 | Excellent 16.4% |
Demographics Similar to Apache by Child Poverty Under the Age of 5
In terms of child poverty under the age of 5, the demographic groups most similar to Apache are Kiowa (24.5%, a difference of 2.2%), Native/Alaskan (25.6%, a difference of 2.2%), Black/African American (25.7%, a difference of 2.8%), Colville (25.7%, a difference of 2.8%), and Creek (24.2%, a difference of 3.2%).
| Demographics | Rating | Rank | Child Poverty Under the Age of 5 |
| Immigrants | Congo | 0.0 /100 | #325 | Tragic 23.9% |
| Central American Indians | 0.0 /100 | #326 | Tragic 23.9% |
| Dominicans | 0.0 /100 | #327 | Tragic 24.0% |
| Immigrants | Dominican Republic | 0.0 /100 | #328 | Tragic 24.1% |
| Cajuns | 0.0 /100 | #329 | Tragic 24.1% |
| Creek | 0.0 /100 | #330 | Tragic 24.2% |
| Kiowa | 0.0 /100 | #331 | Tragic 24.5% |
| Apache | 0.0 /100 | #332 | Tragic 25.0% |
| Natives/Alaskans | 0.0 /100 | #333 | Tragic 25.6% |
| Blacks/African Americans | 0.0 /100 | #334 | Tragic 25.7% |
| Colville | 0.0 /100 | #335 | Tragic 25.7% |
| Sioux | 0.0 /100 | #336 | Tragic 26.9% |
| Pima | 0.0 /100 | #337 | Tragic 27.4% |
| Hopi | 0.0 /100 | #338 | Tragic 27.7% |
| Yup'ik | 0.0 /100 | #339 | Tragic 27.7% |