Immigrants from Dominican Republic vs Immigrants from South Africa Married-Couple Family Poverty
COMPARE
Immigrants from Dominican Republic
Immigrants from South Africa
Married-Couple Family Poverty
Married-Couple Family Poverty Comparison
Immigrants from Dominican Republic
Immigrants from South Africa
8.4%
MARRIED-COUPLE FAMILY POVERTY
0.0/ 100
METRIC RATING
334th/ 347
METRIC RANK
4.5%
MARRIED-COUPLE FAMILY POVERTY
99.1/ 100
METRIC RATING
76th/ 347
METRIC RANK
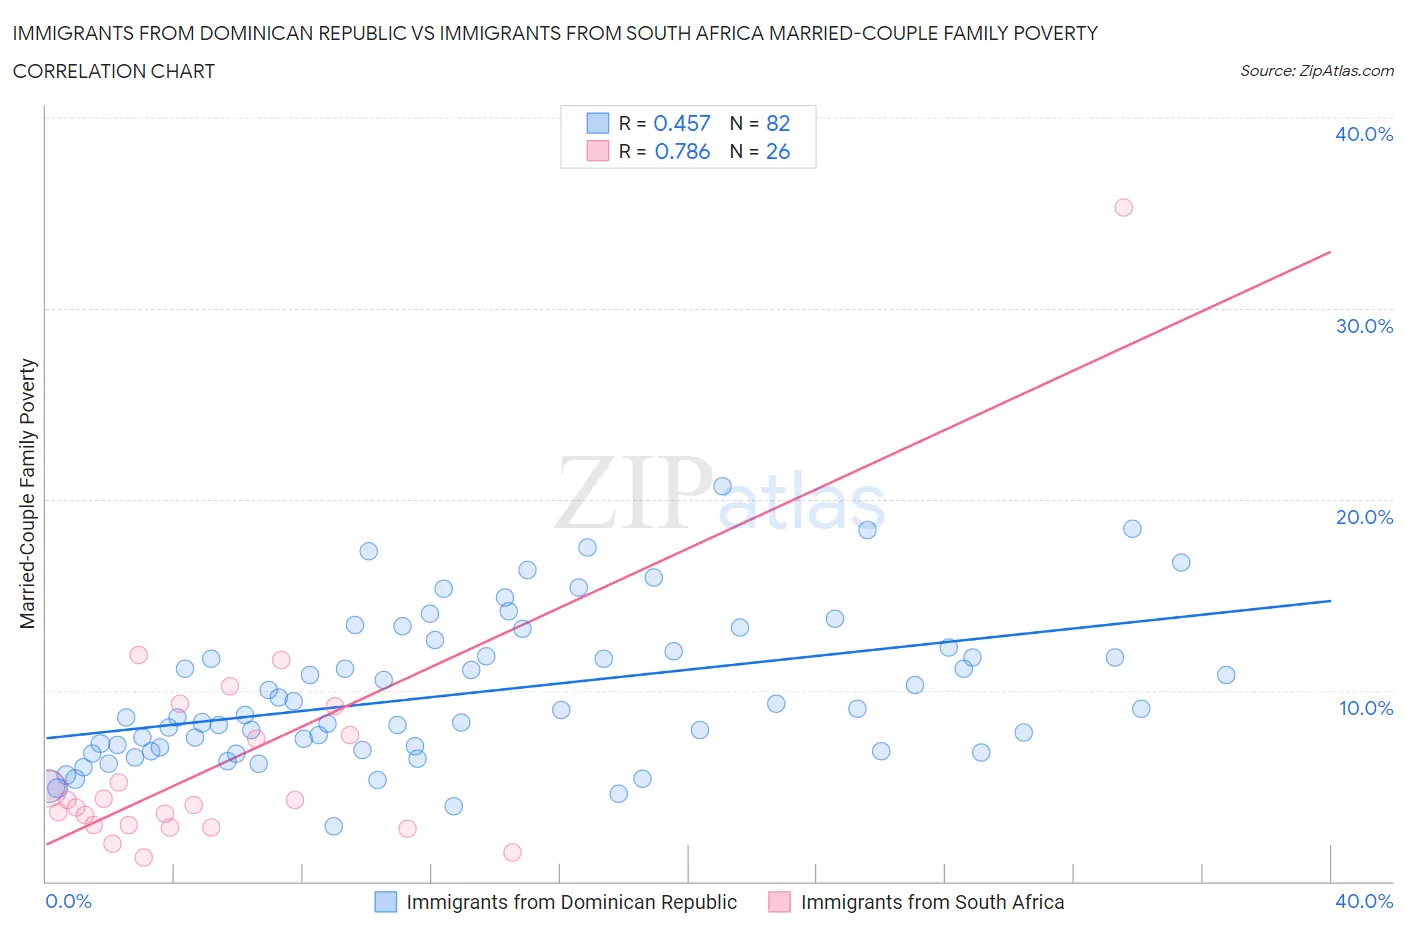
Immigrants from Dominican Republic vs Immigrants from South Africa Married-Couple Family Poverty Correlation Chart
The statistical analysis conducted on geographies consisting of 272,952,781 people shows a moderate positive correlation between the proportion of Immigrants from Dominican Republic and poverty level among married-couple families in the United States with a correlation coefficient (R) of 0.457 and weighted average of 8.4%. Similarly, the statistical analysis conducted on geographies consisting of 231,973,185 people shows a strong positive correlation between the proportion of Immigrants from South Africa and poverty level among married-couple families in the United States with a correlation coefficient (R) of 0.786 and weighted average of 4.5%, a difference of 86.6%.
Married-Couple Family Poverty Correlation Summary
| Measurement | Immigrants from Dominican Republic | Immigrants from South Africa |
| Minimum | 2.9% | 1.2% |
| Maximum | 20.7% | 35.3% |
| Range | 17.8% | 34.1% |
| Mean | 9.9% | 6.3% |
| Median | 8.8% | 4.1% |
| Interquartile 25% (IQ1) | 6.9% | 2.9% |
| Interquartile 75% (IQ3) | 12.1% | 7.7% |
| Interquartile Range (IQR) | 5.2% | 4.8% |
| Standard Deviation (Sample) | 3.8% | 6.7% |
| Standard Deviation (Population) | 3.8% | 6.5% |
Similar Demographics by Married-Couple Family Poverty
Demographics Similar to Immigrants from Dominican Republic by Married-Couple Family Poverty
In terms of married-couple family poverty, the demographic groups most similar to Immigrants from Dominican Republic are Lumbee (8.3%, a difference of 0.68%), Dominican (8.3%, a difference of 1.1%), Central American Indian (8.3%, a difference of 1.2%), Paiute (8.3%, a difference of 1.3%), and Native/Alaskan (8.2%, a difference of 2.5%).
| Demographics | Rating | Rank | Married-Couple Family Poverty |
| Hispanics or Latinos | 0.0 /100 | #327 | Tragic 7.5% |
| Immigrants | Mexico | 0.0 /100 | #328 | Tragic 7.6% |
| Natives/Alaskans | 0.0 /100 | #329 | Tragic 8.2% |
| Paiute | 0.0 /100 | #330 | Tragic 8.3% |
| Central American Indians | 0.0 /100 | #331 | Tragic 8.3% |
| Dominicans | 0.0 /100 | #332 | Tragic 8.3% |
| Lumbee | 0.0 /100 | #333 | Tragic 8.3% |
| Immigrants | Dominican Republic | 0.0 /100 | #334 | Tragic 8.4% |
| Sioux | 0.0 /100 | #335 | Tragic 8.7% |
| Apache | 0.0 /100 | #336 | Tragic 9.0% |
| Yakama | 0.0 /100 | #337 | Tragic 9.0% |
| Cheyenne | 0.0 /100 | #338 | Tragic 9.4% |
| Crow | 0.0 /100 | #339 | Tragic 9.6% |
| Yuman | 0.0 /100 | #340 | Tragic 9.7% |
| Pueblo | 0.0 /100 | #341 | Tragic 11.1% |
Demographics Similar to Immigrants from South Africa by Married-Couple Family Poverty
In terms of married-couple family poverty, the demographic groups most similar to Immigrants from South Africa are Cambodian (4.5%, a difference of 0.11%), Immigrants from Latvia (4.5%, a difference of 0.17%), Scotch-Irish (4.5%, a difference of 0.25%), Immigrants from Austria (4.5%, a difference of 0.38%), and Ukrainian (4.5%, a difference of 0.48%).
| Demographics | Rating | Rank | Married-Couple Family Poverty |
| New Zealanders | 99.4 /100 | #69 | Exceptional 4.4% |
| Immigrants | Korea | 99.4 /100 | #70 | Exceptional 4.5% |
| Immigrants | North America | 99.3 /100 | #71 | Exceptional 4.5% |
| Immigrants | England | 99.3 /100 | #72 | Exceptional 4.5% |
| Ukrainians | 99.2 /100 | #73 | Exceptional 4.5% |
| Immigrants | Austria | 99.2 /100 | #74 | Exceptional 4.5% |
| Cambodians | 99.2 /100 | #75 | Exceptional 4.5% |
| Immigrants | South Africa | 99.1 /100 | #76 | Exceptional 4.5% |
| Immigrants | Latvia | 99.1 /100 | #77 | Exceptional 4.5% |
| Scotch-Irish | 99.1 /100 | #78 | Exceptional 4.5% |
| Immigrants | Iran | 99.0 /100 | #79 | Exceptional 4.5% |
| Icelanders | 99.0 /100 | #80 | Exceptional 4.5% |
| Immigrants | Greece | 98.9 /100 | #81 | Exceptional 4.5% |
| Canadians | 98.8 /100 | #82 | Exceptional 4.5% |
| Immigrants | Denmark | 98.8 /100 | #83 | Exceptional 4.6% |