Immigrants from Dominican Republic vs Dutch Female Poverty
COMPARE
Immigrants from Dominican Republic
Dutch
Female Poverty
Female Poverty Comparison
Immigrants from Dominican Republic
Dutch
19.3%
FEMALE POVERTY
0.0/ 100
METRIC RATING
333rd/ 347
METRIC RANK
12.4%
FEMALE POVERTY
96.5/ 100
METRIC RATING
86th/ 347
METRIC RANK
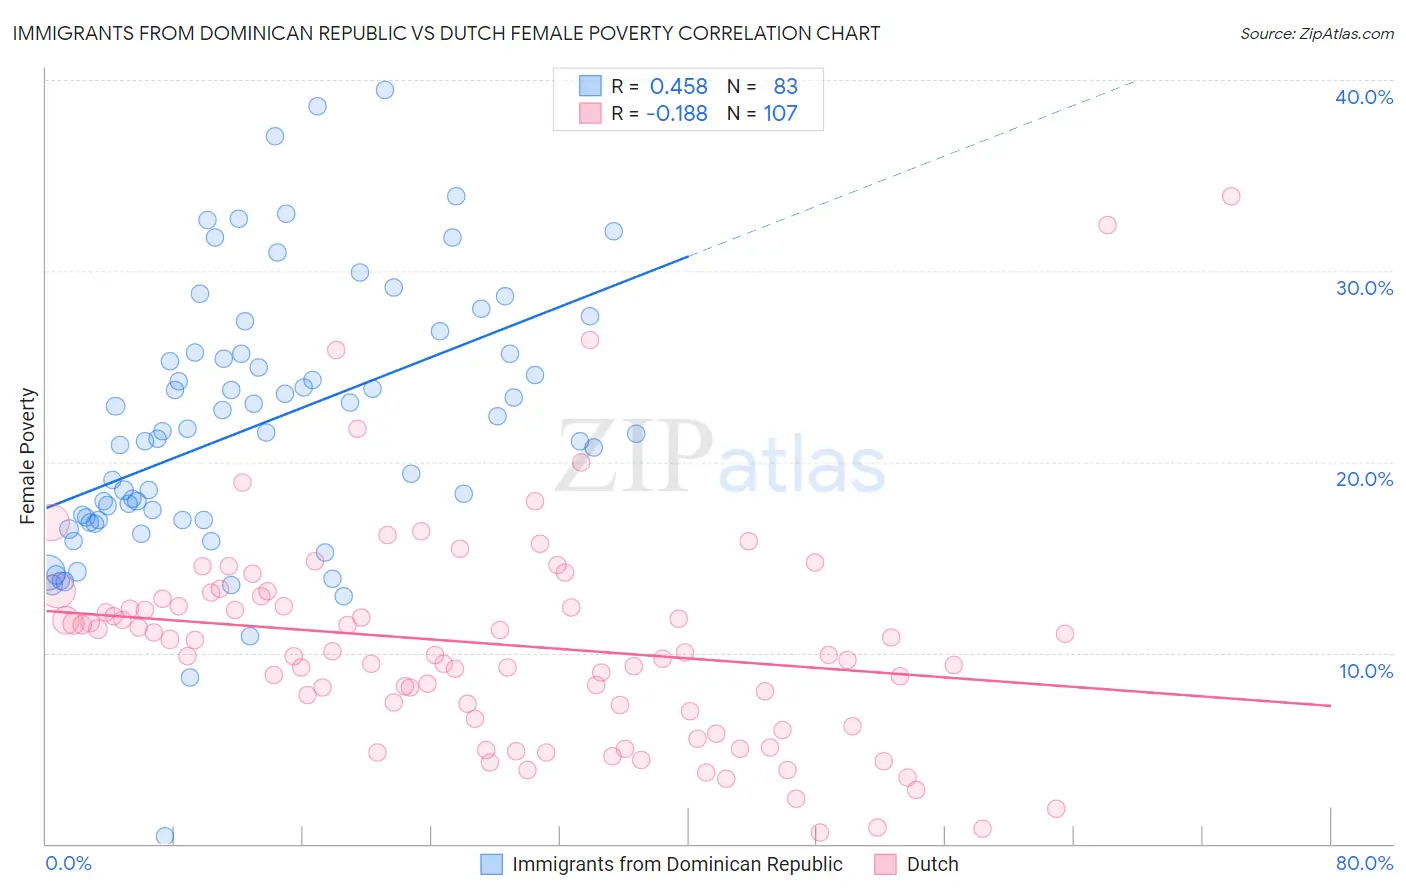
Immigrants from Dominican Republic vs Dutch Female Poverty Correlation Chart
The statistical analysis conducted on geographies consisting of 274,906,284 people shows a moderate positive correlation between the proportion of Immigrants from Dominican Republic and poverty level among females in the United States with a correlation coefficient (R) of 0.458 and weighted average of 19.3%. Similarly, the statistical analysis conducted on geographies consisting of 553,347,784 people shows a poor negative correlation between the proportion of Dutch and poverty level among females in the United States with a correlation coefficient (R) of -0.188 and weighted average of 12.4%, a difference of 56.4%.
Female Poverty Correlation Summary
| Measurement | Immigrants from Dominican Republic | Dutch |
| Minimum | 0.39% | 0.60% |
| Maximum | 39.5% | 33.9% |
| Range | 39.1% | 33.3% |
| Mean | 21.9% | 10.5% |
| Median | 21.5% | 9.9% |
| Interquartile 25% (IQ1) | 17.0% | 6.5% |
| Interquartile 75% (IQ3) | 25.7% | 12.8% |
| Interquartile Range (IQR) | 8.7% | 6.3% |
| Standard Deviation (Sample) | 7.0% | 5.8% |
| Standard Deviation (Population) | 7.0% | 5.7% |
Similar Demographics by Female Poverty
Demographics Similar to Immigrants from Dominican Republic by Female Poverty
In terms of female poverty, the demographic groups most similar to Immigrants from Dominican Republic are Apache (19.2%, a difference of 0.60%), Native/Alaskan (19.2%, a difference of 0.76%), Dominican (19.1%, a difference of 1.2%), Houma (20.0%, a difference of 3.6%), and Kiowa (18.6%, a difference of 3.9%).
| Demographics | Rating | Rank | Female Poverty |
| Central American Indians | 0.0 /100 | #326 | Tragic 18.0% |
| Yakama | 0.0 /100 | #327 | Tragic 18.0% |
| Blacks/African Americans | 0.0 /100 | #328 | Tragic 18.6% |
| Kiowa | 0.0 /100 | #329 | Tragic 18.6% |
| Dominicans | 0.0 /100 | #330 | Tragic 19.1% |
| Natives/Alaskans | 0.0 /100 | #331 | Tragic 19.2% |
| Apache | 0.0 /100 | #332 | Tragic 19.2% |
| Immigrants | Dominican Republic | 0.0 /100 | #333 | Tragic 19.3% |
| Houma | 0.0 /100 | #334 | Tragic 20.0% |
| Cheyenne | 0.0 /100 | #335 | Tragic 20.2% |
| Pueblo | 0.0 /100 | #336 | Tragic 20.7% |
| Yuman | 0.0 /100 | #337 | Tragic 20.8% |
| Sioux | 0.0 /100 | #338 | Tragic 20.9% |
| Hopi | 0.0 /100 | #339 | Tragic 21.0% |
| Yup'ik | 0.0 /100 | #340 | Tragic 21.5% |
Demographics Similar to Dutch by Female Poverty
In terms of female poverty, the demographic groups most similar to Dutch are Okinawan (12.4%, a difference of 0.020%), Irish (12.4%, a difference of 0.030%), Finnish (12.4%, a difference of 0.060%), Northern European (12.4%, a difference of 0.080%), and English (12.4%, a difference of 0.26%).
| Demographics | Rating | Rank | Female Poverty |
| Immigrants | North America | 97.1 /100 | #79 | Exceptional 12.3% |
| Slovaks | 97.1 /100 | #80 | Exceptional 12.3% |
| Immigrants | Sweden | 97.1 /100 | #81 | Exceptional 12.3% |
| Jordanians | 97.1 /100 | #82 | Exceptional 12.3% |
| Immigrants | England | 96.9 /100 | #83 | Exceptional 12.3% |
| Northern Europeans | 96.6 /100 | #84 | Exceptional 12.4% |
| Irish | 96.5 /100 | #85 | Exceptional 12.4% |
| Dutch | 96.5 /100 | #86 | Exceptional 12.4% |
| Okinawans | 96.4 /100 | #87 | Exceptional 12.4% |
| Finns | 96.4 /100 | #88 | Exceptional 12.4% |
| English | 96.1 /100 | #89 | Exceptional 12.4% |
| Immigrants | Denmark | 95.8 /100 | #90 | Exceptional 12.4% |
| Belgians | 95.8 /100 | #91 | Exceptional 12.4% |
| Czechoslovakians | 95.7 /100 | #92 | Exceptional 12.4% |
| Immigrants | Egypt | 95.5 /100 | #93 | Exceptional 12.5% |