Portuguese vs Dutch Female Poverty
COMPARE
Portuguese
Dutch
Female Poverty
Female Poverty Comparison
Portuguese
Dutch
12.6%
FEMALE POVERTY
93.1/ 100
METRIC RATING
108th/ 347
METRIC RANK
12.4%
FEMALE POVERTY
96.5/ 100
METRIC RATING
86th/ 347
METRIC RANK
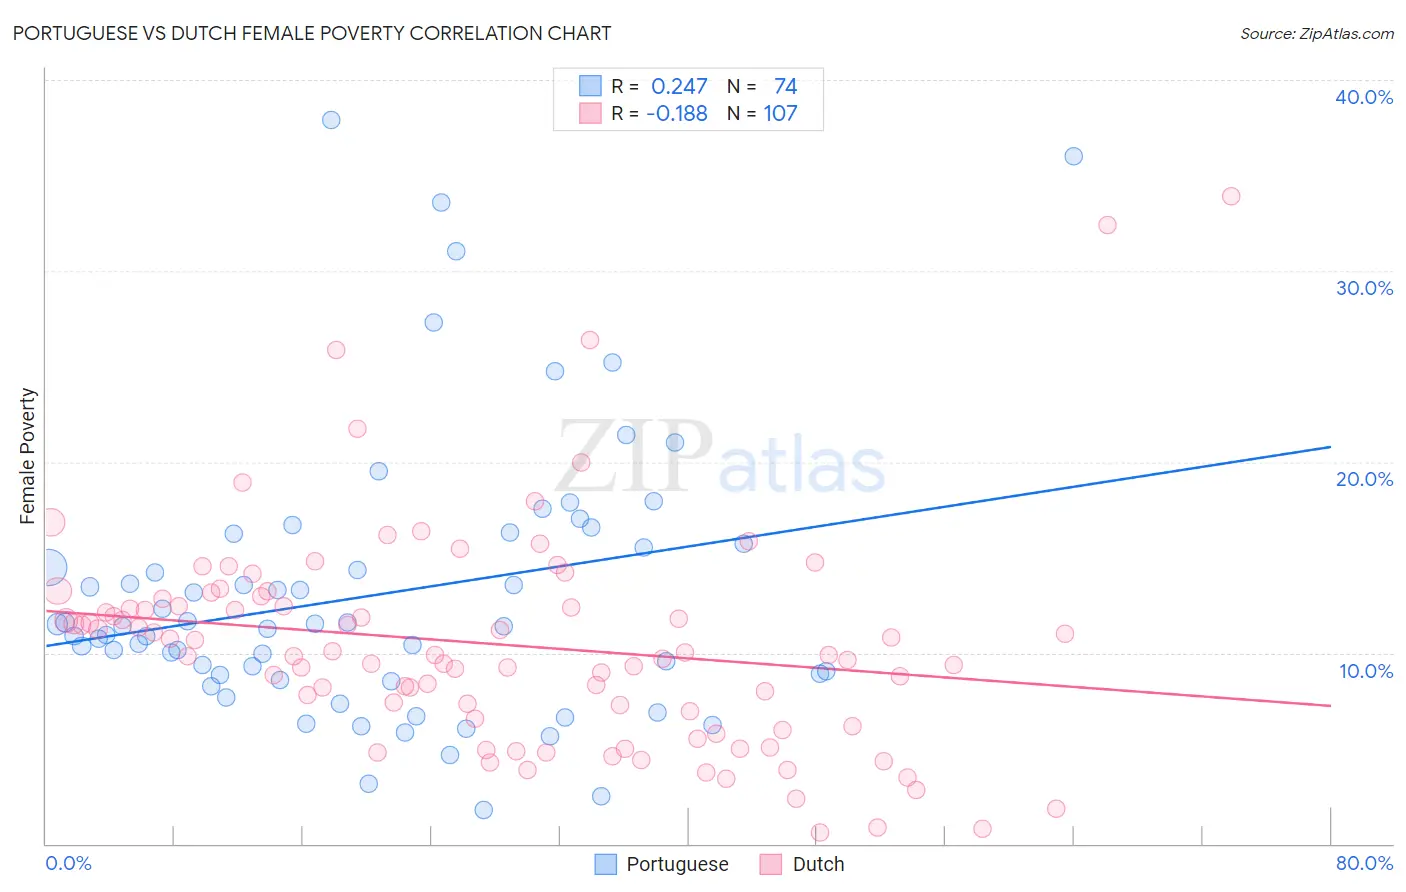
Portuguese vs Dutch Female Poverty Correlation Chart
The statistical analysis conducted on geographies consisting of 449,805,849 people shows a weak positive correlation between the proportion of Portuguese and poverty level among females in the United States with a correlation coefficient (R) of 0.247 and weighted average of 12.6%. Similarly, the statistical analysis conducted on geographies consisting of 553,347,784 people shows a poor negative correlation between the proportion of Dutch and poverty level among females in the United States with a correlation coefficient (R) of -0.188 and weighted average of 12.4%, a difference of 1.8%.
Female Poverty Correlation Summary
| Measurement | Portuguese | Dutch |
| Minimum | 1.8% | 0.60% |
| Maximum | 37.9% | 33.9% |
| Range | 36.1% | 33.3% |
| Mean | 13.0% | 10.5% |
| Median | 11.4% | 9.9% |
| Interquartile 25% (IQ1) | 8.8% | 6.5% |
| Interquartile 75% (IQ3) | 15.7% | 12.8% |
| Interquartile Range (IQR) | 6.9% | 6.3% |
| Standard Deviation (Sample) | 7.2% | 5.8% |
| Standard Deviation (Population) | 7.2% | 5.7% |
Similar Demographics by Female Poverty
Demographics Similar to Portuguese by Female Poverty
In terms of female poverty, the demographic groups most similar to Portuguese are Immigrants from Zimbabwe (12.6%, a difference of 0.020%), Paraguayan (12.6%, a difference of 0.040%), Laotian (12.6%, a difference of 0.10%), Soviet Union (12.6%, a difference of 0.27%), and Immigrants from Turkey (12.6%, a difference of 0.29%).
| Demographics | Rating | Rank | Female Poverty |
| Tlingit-Haida | 94.8 /100 | #101 | Exceptional 12.5% |
| Immigrants | China | 94.5 /100 | #102 | Exceptional 12.5% |
| Slavs | 94.5 /100 | #103 | Exceptional 12.5% |
| Palestinians | 94.3 /100 | #104 | Exceptional 12.5% |
| Scottish | 94.1 /100 | #105 | Exceptional 12.5% |
| Immigrants | Turkey | 93.8 /100 | #106 | Exceptional 12.6% |
| Laotians | 93.4 /100 | #107 | Exceptional 12.6% |
| Portuguese | 93.1 /100 | #108 | Exceptional 12.6% |
| Immigrants | Zimbabwe | 93.1 /100 | #109 | Exceptional 12.6% |
| Paraguayans | 93.0 /100 | #110 | Exceptional 12.6% |
| Soviet Union | 92.4 /100 | #111 | Exceptional 12.6% |
| Immigrants | Israel | 92.0 /100 | #112 | Exceptional 12.6% |
| Canadians | 92.0 /100 | #113 | Exceptional 12.7% |
| Welsh | 91.6 /100 | #114 | Exceptional 12.7% |
| Puget Sound Salish | 91.5 /100 | #115 | Exceptional 12.7% |
Demographics Similar to Dutch by Female Poverty
In terms of female poverty, the demographic groups most similar to Dutch are Okinawan (12.4%, a difference of 0.020%), Irish (12.4%, a difference of 0.030%), Finnish (12.4%, a difference of 0.060%), Northern European (12.4%, a difference of 0.080%), and English (12.4%, a difference of 0.26%).
| Demographics | Rating | Rank | Female Poverty |
| Immigrants | North America | 97.1 /100 | #79 | Exceptional 12.3% |
| Slovaks | 97.1 /100 | #80 | Exceptional 12.3% |
| Immigrants | Sweden | 97.1 /100 | #81 | Exceptional 12.3% |
| Jordanians | 97.1 /100 | #82 | Exceptional 12.3% |
| Immigrants | England | 96.9 /100 | #83 | Exceptional 12.3% |
| Northern Europeans | 96.6 /100 | #84 | Exceptional 12.4% |
| Irish | 96.5 /100 | #85 | Exceptional 12.4% |
| Dutch | 96.5 /100 | #86 | Exceptional 12.4% |
| Okinawans | 96.4 /100 | #87 | Exceptional 12.4% |
| Finns | 96.4 /100 | #88 | Exceptional 12.4% |
| English | 96.1 /100 | #89 | Exceptional 12.4% |
| Immigrants | Denmark | 95.8 /100 | #90 | Exceptional 12.4% |
| Belgians | 95.8 /100 | #91 | Exceptional 12.4% |
| Czechoslovakians | 95.7 /100 | #92 | Exceptional 12.4% |
| Immigrants | Egypt | 95.5 /100 | #93 | Exceptional 12.5% |