Slavic vs Dutch Female Poverty
COMPARE
Slavic
Dutch
Female Poverty
Female Poverty Comparison
Slavs
Dutch
12.5%
FEMALE POVERTY
94.5/ 100
METRIC RATING
103rd/ 347
METRIC RANK
12.4%
FEMALE POVERTY
96.5/ 100
METRIC RATING
86th/ 347
METRIC RANK
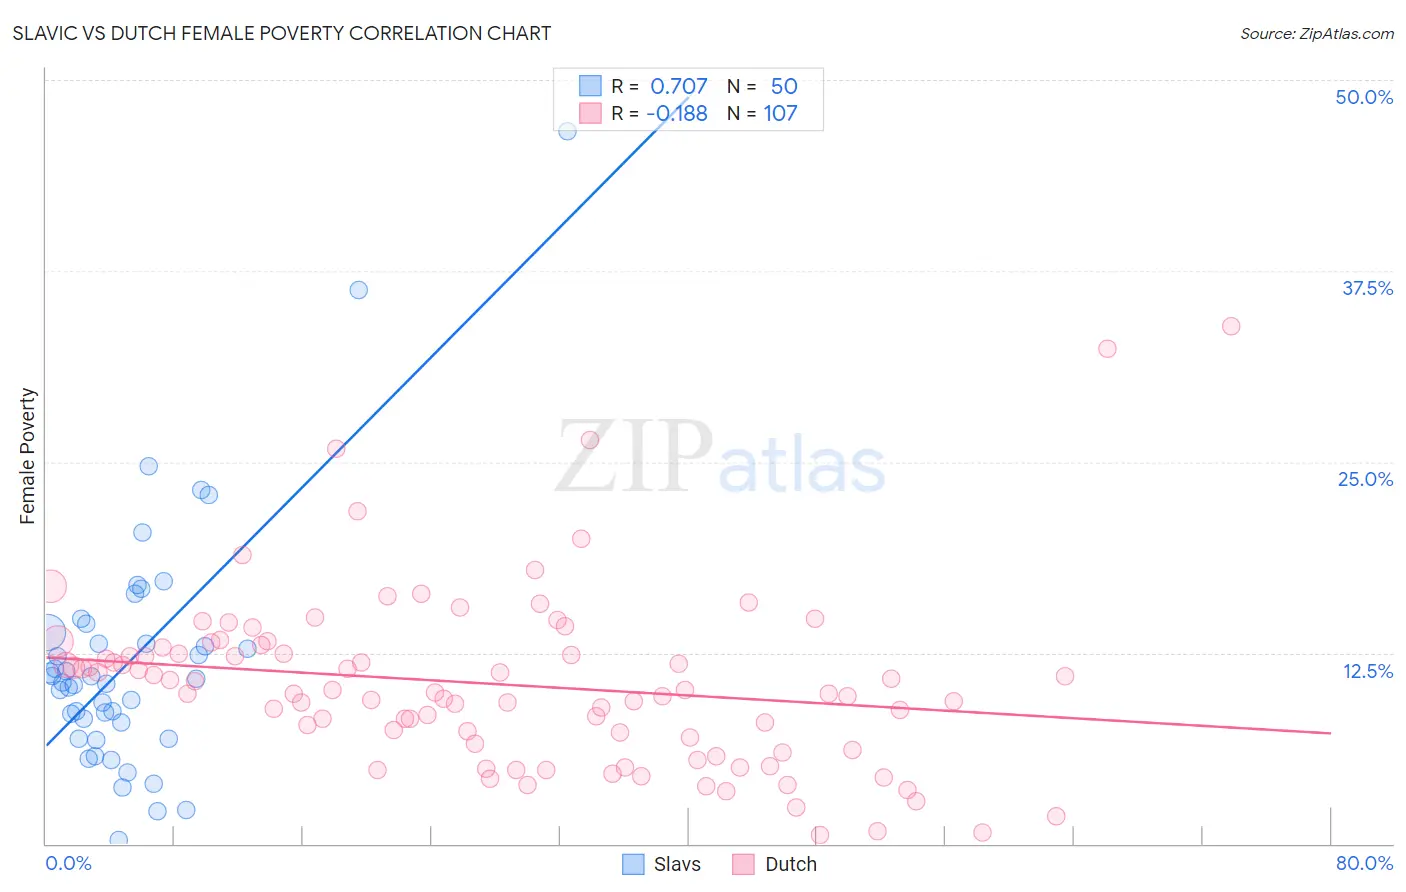
Slavic vs Dutch Female Poverty Correlation Chart
The statistical analysis conducted on geographies consisting of 270,757,305 people shows a strong positive correlation between the proportion of Slavs and poverty level among females in the United States with a correlation coefficient (R) of 0.707 and weighted average of 12.5%. Similarly, the statistical analysis conducted on geographies consisting of 553,347,784 people shows a poor negative correlation between the proportion of Dutch and poverty level among females in the United States with a correlation coefficient (R) of -0.188 and weighted average of 12.4%, a difference of 1.2%.
Female Poverty Correlation Summary
| Measurement | Slavic | Dutch |
| Minimum | 0.21% | 0.60% |
| Maximum | 46.6% | 33.9% |
| Range | 46.4% | 33.3% |
| Mean | 12.0% | 10.5% |
| Median | 10.7% | 9.9% |
| Interquartile 25% (IQ1) | 7.9% | 6.5% |
| Interquartile 75% (IQ3) | 13.8% | 12.8% |
| Interquartile Range (IQR) | 5.9% | 6.3% |
| Standard Deviation (Sample) | 8.1% | 5.8% |
| Standard Deviation (Population) | 8.0% | 5.7% |
Demographics Similar to Slavs and Dutch by Female Poverty
In terms of female poverty, the demographic groups most similar to Slavs are Immigrants from China (12.5%, a difference of 0.020%), Palestinian (12.5%, a difference of 0.090%), Immigrants from Latvia (12.5%, a difference of 0.17%), Tlingit-Haida (12.5%, a difference of 0.17%), and Romanian (12.5%, a difference of 0.32%). Similarly, the demographic groups most similar to Dutch are Okinawan (12.4%, a difference of 0.020%), Irish (12.4%, a difference of 0.030%), Finnish (12.4%, a difference of 0.060%), Northern European (12.4%, a difference of 0.080%), and English (12.4%, a difference of 0.26%).
| Demographics | Rating | Rank | Female Poverty |
| Northern Europeans | 96.6 /100 | #84 | Exceptional 12.4% |
| Irish | 96.5 /100 | #85 | Exceptional 12.4% |
| Dutch | 96.5 /100 | #86 | Exceptional 12.4% |
| Okinawans | 96.4 /100 | #87 | Exceptional 12.4% |
| Finns | 96.4 /100 | #88 | Exceptional 12.4% |
| English | 96.1 /100 | #89 | Exceptional 12.4% |
| Immigrants | Denmark | 95.8 /100 | #90 | Exceptional 12.4% |
| Belgians | 95.8 /100 | #91 | Exceptional 12.4% |
| Czechoslovakians | 95.7 /100 | #92 | Exceptional 12.4% |
| Immigrants | Egypt | 95.5 /100 | #93 | Exceptional 12.5% |
| Immigrants | Indonesia | 95.4 /100 | #94 | Exceptional 12.5% |
| Immigrants | South Africa | 95.4 /100 | #95 | Exceptional 12.5% |
| British | 95.2 /100 | #96 | Exceptional 12.5% |
| Australians | 95.2 /100 | #97 | Exceptional 12.5% |
| Native Hawaiians | 95.1 /100 | #98 | Exceptional 12.5% |
| Romanians | 95.1 /100 | #99 | Exceptional 12.5% |
| Immigrants | Latvia | 94.8 /100 | #100 | Exceptional 12.5% |
| Tlingit-Haida | 94.8 /100 | #101 | Exceptional 12.5% |
| Immigrants | China | 94.5 /100 | #102 | Exceptional 12.5% |
| Slavs | 94.5 /100 | #103 | Exceptional 12.5% |
| Palestinians | 94.3 /100 | #104 | Exceptional 12.5% |