Immigrants from Croatia vs Native/Alaskan In Labor Force | Age 35-44
COMPARE
Immigrants from Croatia
Native/Alaskan
In Labor Force | Age 35-44
In Labor Force | Age 35-44 Comparison
Immigrants from Croatia
Natives/Alaskans
85.1%
IN LABOR FORCE | AGE 35-44
99.5/ 100
METRIC RATING
56th/ 347
METRIC RANK
78.9%
IN LABOR FORCE | AGE 35-44
0.0/ 100
METRIC RATING
335th/ 347
METRIC RANK
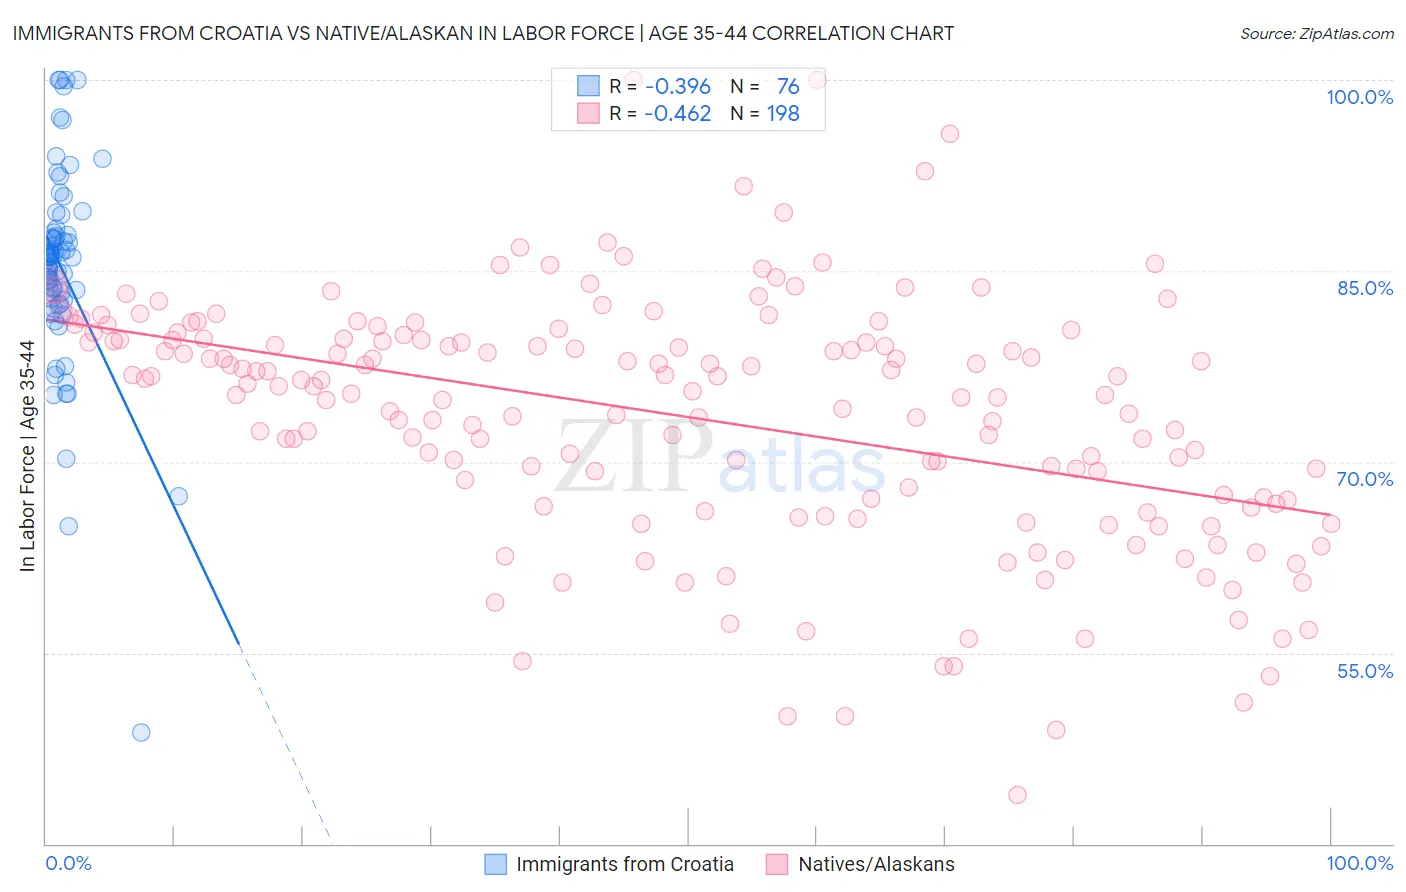
Immigrants from Croatia vs Native/Alaskan In Labor Force | Age 35-44 Correlation Chart
The statistical analysis conducted on geographies consisting of 132,569,777 people shows a mild negative correlation between the proportion of Immigrants from Croatia and labor force participation rate among population between the ages 35 and 44 in the United States with a correlation coefficient (R) of -0.396 and weighted average of 85.1%. Similarly, the statistical analysis conducted on geographies consisting of 512,690,286 people shows a moderate negative correlation between the proportion of Natives/Alaskans and labor force participation rate among population between the ages 35 and 44 in the United States with a correlation coefficient (R) of -0.462 and weighted average of 78.9%, a difference of 7.9%.
In Labor Force | Age 35-44 Correlation Summary
| Measurement | Immigrants from Croatia | Native/Alaskan |
| Minimum | 48.7% | 43.8% |
| Maximum | 100.0% | 100.0% |
| Range | 51.3% | 56.2% |
| Mean | 85.3% | 73.5% |
| Median | 86.1% | 75.7% |
| Interquartile 25% (IQ1) | 82.8% | 67.0% |
| Interquartile 75% (IQ3) | 87.9% | 79.7% |
| Interquartile Range (IQR) | 5.2% | 12.7% |
| Standard Deviation (Sample) | 8.1% | 9.6% |
| Standard Deviation (Population) | 8.0% | 9.6% |
Similar Demographics by In Labor Force | Age 35-44
Demographics Similar to Immigrants from Croatia by In Labor Force | Age 35-44
In terms of in labor force | age 35-44, the demographic groups most similar to Immigrants from Croatia are Turkish (85.1%, a difference of 0.010%), Soviet Union (85.1%, a difference of 0.010%), Chinese (85.1%, a difference of 0.020%), Slovak (85.1%, a difference of 0.020%), and Serbian (85.1%, a difference of 0.020%).
| Demographics | Rating | Rank | In Labor Force | Age 35-44 |
| Croatians | 99.7 /100 | #49 | Exceptional 85.2% |
| Thais | 99.7 /100 | #50 | Exceptional 85.2% |
| Immigrants | Albania | 99.7 /100 | #51 | Exceptional 85.1% |
| Immigrants | Kenya | 99.6 /100 | #52 | Exceptional 85.1% |
| Taiwanese | 99.6 /100 | #53 | Exceptional 85.1% |
| Turks | 99.5 /100 | #54 | Exceptional 85.1% |
| Soviet Union | 99.5 /100 | #55 | Exceptional 85.1% |
| Immigrants | Croatia | 99.5 /100 | #56 | Exceptional 85.1% |
| Chinese | 99.4 /100 | #57 | Exceptional 85.1% |
| Slovaks | 99.4 /100 | #58 | Exceptional 85.1% |
| Serbians | 99.4 /100 | #59 | Exceptional 85.1% |
| Albanians | 99.4 /100 | #60 | Exceptional 85.1% |
| Immigrants | Latvia | 99.3 /100 | #61 | Exceptional 85.0% |
| Immigrants | Moldova | 99.3 /100 | #62 | Exceptional 85.0% |
| Immigrants | Uganda | 99.3 /100 | #63 | Exceptional 85.0% |
Demographics Similar to Natives/Alaskans by In Labor Force | Age 35-44
In terms of in labor force | age 35-44, the demographic groups most similar to Natives/Alaskans are Yakama (79.0%, a difference of 0.11%), Kiowa (79.2%, a difference of 0.40%), Ute (79.4%, a difference of 0.73%), Houma (79.5%, a difference of 0.79%), and Cheyenne (79.5%, a difference of 0.81%).
| Demographics | Rating | Rank | In Labor Force | Age 35-44 |
| Creek | 0.0 /100 | #328 | Tragic 80.0% |
| Menominee | 0.0 /100 | #329 | Tragic 79.7% |
| Cheyenne | 0.0 /100 | #330 | Tragic 79.5% |
| Houma | 0.0 /100 | #331 | Tragic 79.5% |
| Ute | 0.0 /100 | #332 | Tragic 79.4% |
| Kiowa | 0.0 /100 | #333 | Tragic 79.2% |
| Yakama | 0.0 /100 | #334 | Tragic 79.0% |
| Natives/Alaskans | 0.0 /100 | #335 | Tragic 78.9% |
| Arapaho | 0.0 /100 | #336 | Tragic 78.1% |
| Apache | 0.0 /100 | #337 | Tragic 77.9% |
| Pueblo | 0.0 /100 | #338 | Tragic 77.4% |
| Yup'ik | 0.0 /100 | #339 | Tragic 77.3% |
| Lumbee | 0.0 /100 | #340 | Tragic 77.0% |
| Hopi | 0.0 /100 | #341 | Tragic 77.0% |
| Crow | 0.0 /100 | #342 | Tragic 76.5% |